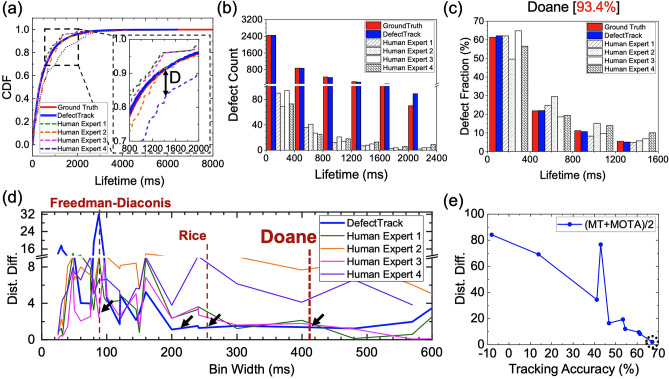
Figure 7.
Comparison of the defect lifetime distribution prediction by DefectTrack and by Human Experts with the ground truth. (a) The cumulative distribution functions (CDF) of defect lifetime distribution of ground truth, as predicted by DefectTrack, and four human expert measurements. (b) Histogram showing the true lifetime distribution, DefectTrack prediction, and Human Expert measurements. (c) Normalized lifetime histogram. 93.4% of ground truth was included in the comparison after lifetime cutoffs. (d) The calculated distribution-difference (Dist. Diff.) for different bin widths (Fig. S7 and Table S2). The black arrow points to the bin widths at which DefectTrack has the lowest distribution-difference. Note the distribution-difference comparison can only be made for each bin width, and not across bin widths. (e) The correlation between the calculated distribution-difference (Dist. Diff.) on the y-axis and the MOT tracking performance evaluation on the x-axis.

