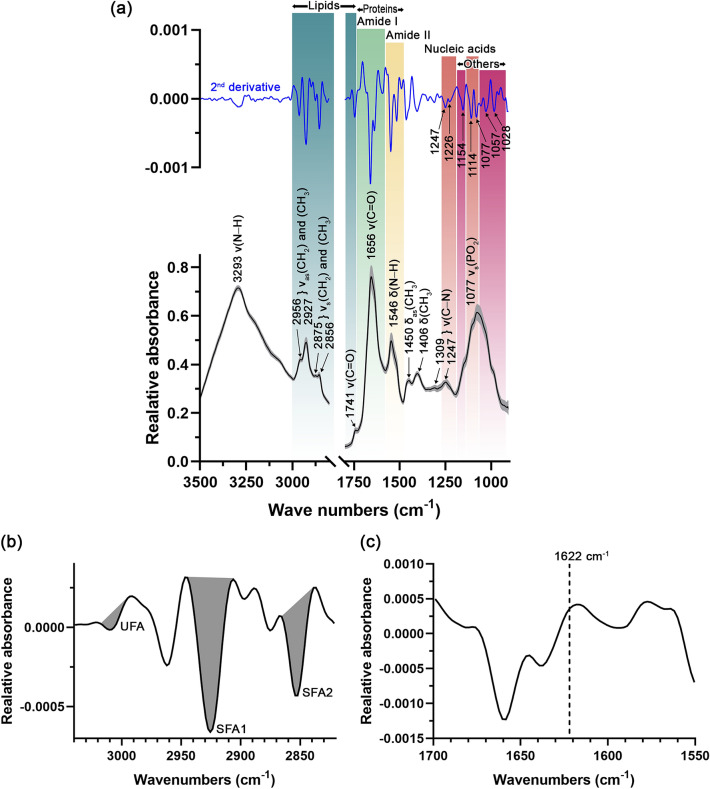
Figure 3.
(a) Primary (black line) and second derivative (blue line) FTIR spectra of biological compositions of EVs derived from Raphanus sativus L. var. caudatus Alef microgreens after background (PBS) subtraction, Savitzky-Golay smoothing (3rd-degree polynomial with 13 smoothing points), and Extended Multiplicative Signal Correction (EMSC) normalization. An averaged spectrum from 118 spectra was presented in black and the standard deviation was indicated by the gray parallel bands. ν = stretching vibration, νas = asymmetrical stretching vibration, νs = symmetrical stretching vibration, and δ = bending vibration. (b) Second derivative spectrum of EVs in lipid region. UFA = unsaturated fatty acid region (3017–2996 cm–1), SFA1 = saturated fatty acid region 1 (2944–2906 cm–1), and SFA2 = saturated fatty acid region 2 (2865–2839 cm–1). Gray areas indicate the area integration range. (c) Second derivative spectrum of EVs in protein region, presenting the absence of 1622 cm–1 band of non-native intermolecular ß-sheet from protein aggregates.

