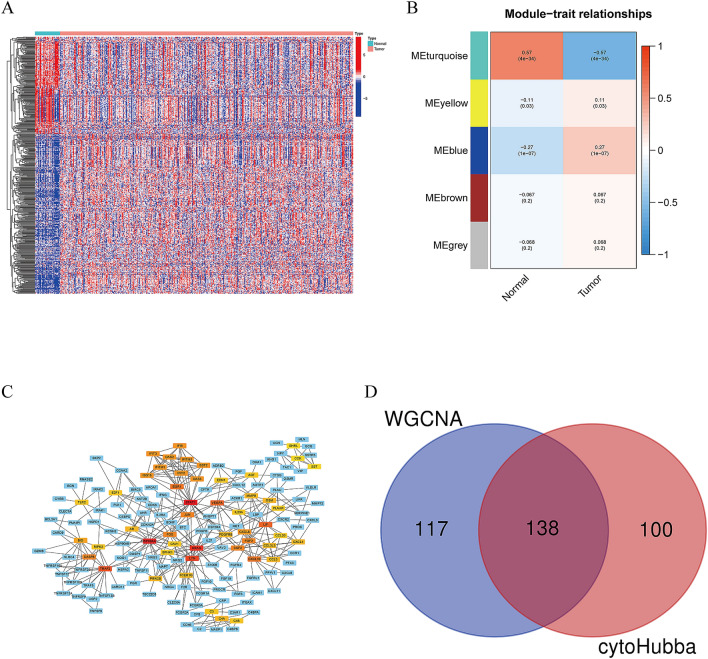
Figure 1.
Selection of immune-related genes. (A) Heatmap showing differential immune-related gene expression between normal and gastric cancer tissues (B) Heatmap of the correlation between normal and tumor tissues on module genes. (C) PPI network diagram of immune hub genes. (D) Venn diagram shows the immune-related genes. [Figures created by R, version 4.0.4. STRING, https://string-db.org/; Cytoscape (https://cytoscape.org/; version 3.9.1)].

