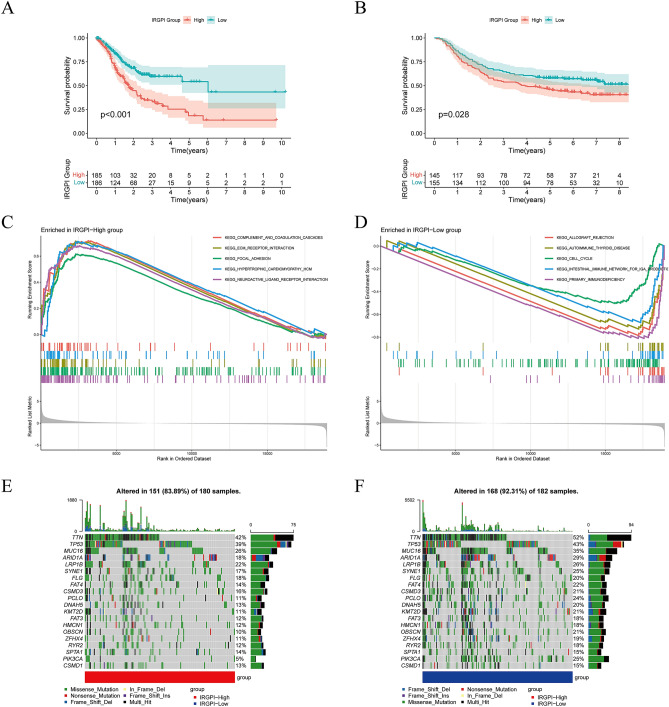
Figure 3.
Prognostic analysis and molecular characteristics of different IRGPI groups. (A) Kaplan–Meier survival analysis of the IRGPI groups in the TCGA cohort. (B) Kaplan–Meier survival analysis of the IRGPI groups in the GEO cohort. (C) Gene sets enriched in IRGPI-High group in TCGA-STAD cohort. (D) Gene sets enriched in IRGPI-Low group in TCGA-STAD cohort. (E) Gene mutation landscape in IRGPI-High group in TCGA-STAD cohort. (F) Gene mutation landscape in IRGPI-Low group in TCGA-STAD cohort. [Figures created by R, version 4.0.4.].

