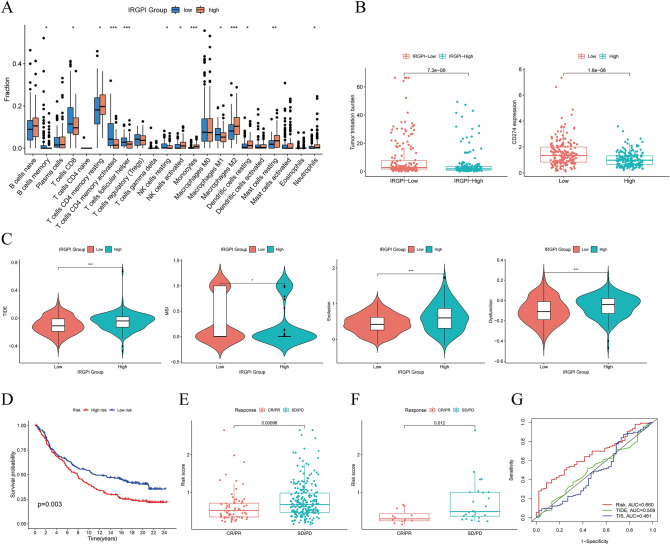
Figure 5.
Prognostic value of IRGPI in immunotherapy. (A) The proportions of immune cells in different IRGPI groups. (B) Comparison of TMB and PD-L1 expression in different IRGPI groups. (C) TIDE, MSI, and T cell exclusion and dysfunction score in different IRGPI groups. (D) Kaplan–Meier survival analysis of the IRGPI groups in the IMvigor210 cohort. (E) IMvigor210 cohort of CR/PR and SD/PD in different IRGPI groups. (F) PRJEB25780 cohort of CR/PR and SD/PD in different IRGPI groups. (G) ROC analysis of IRGPI, TIS, and TIDE on overall survival at 1-, 3-, and 5-years OS in TCGA-STAD cohort. [Figures created by R, version 4.0.4.].

