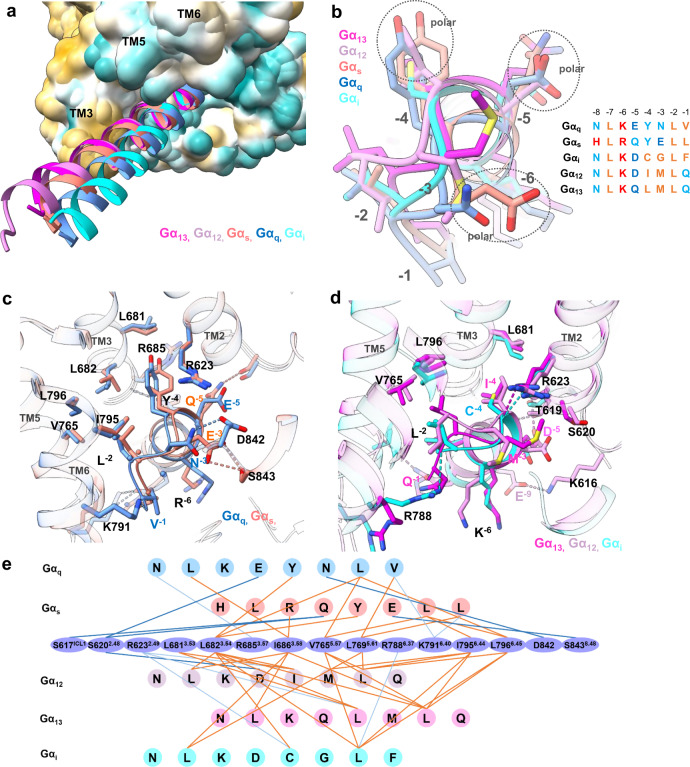
Fig. 5. A comparison of GPR110 engagements with all 4 major G-proteins.
a An overall comparison of αH5 engagements of Gαq, Gαs, Gαi, Gα12 and Gα13 to receptor. Receptor was drawn in hydrophobic surface potential. b A comparison of the very end of αH5 of G-proteins in engagements of GPR110. Left panel, superimposition of αH5 of Gαq, Gαs, Gαi, Gα12 and Gα13 in GPR110 engagements; right panel, an alignment of the last 8 residues of αH5 of Gαq, Gαs, Gαi, Gα12 and Gα13. Brown color marks hydrophobic residues, cyan color marks polar residues, blue color marks negative charged residues and red color marks positive charged residues. c A comparison of the Gq and Gs engagements with GPR110. d A comparison of the Gi, G13 and G12 engagements with GPR110. e A connective interaction map of the αH5/receptor interaction of the Gαq, Gαs, Gαi, Gα12, Gα13/receptor complexes. The thick blue line marks hydrogen bond between side chains, the light and thin blue line marks hydrogen bond between side chain and backbone, the brown line marks hydrophobic interaction.

