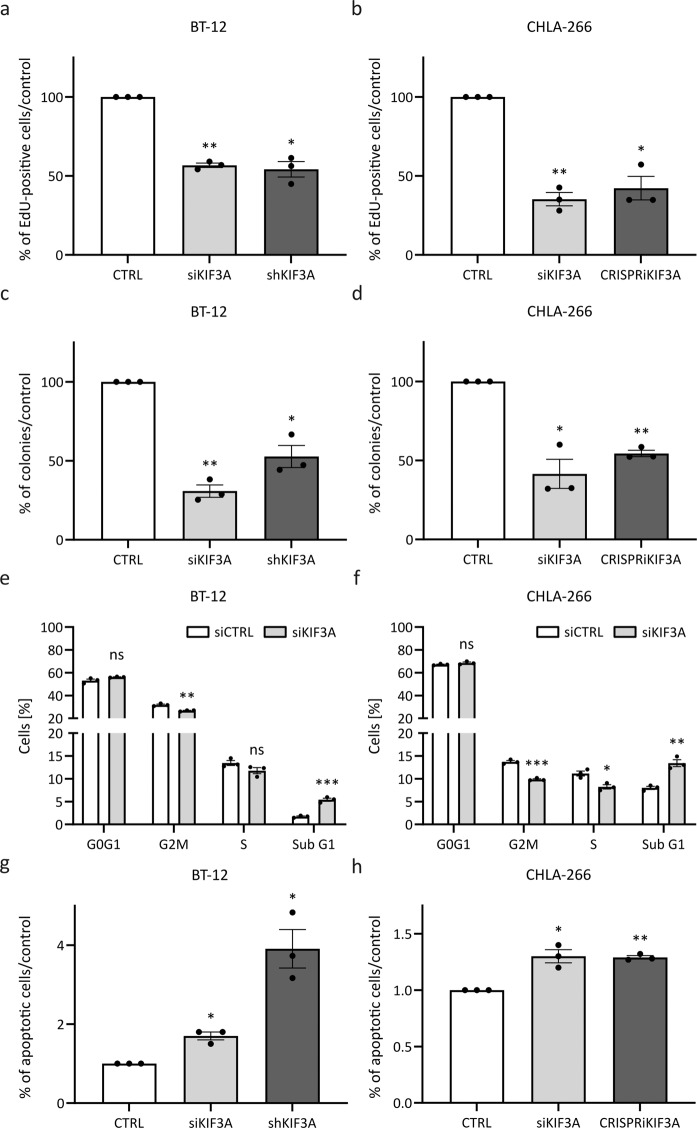
Fig. 2. Knockdown of kinesin family member 3A (KIF3A) decreases the oncogenic potential of the AT/RT cell lines BT‐12 and CHLA‐266.
Transient knockdown of KIF3A was achieved using siPOOLs. Stable knockdown of KIF3A was achieved using shRNA‐based (BT‐12) or CRISPRi‐based (CHLA‐266) technology. a, b Transiently or stably transfected BT‐12 (a) and CHLA‐266 (b) cells were incubated with 10 μM EdU (modified thymidine analogue) for 6 h. Cells were fixed and EdU was detected using Alexa Fluor™ 488 azide. Cells were counterstained with 4´,6‐diamidino‐2 phenylindole (DAPI). The percentage of proliferating cells was calculated based on the number of EdU‐labeled cells in relation to the number of DAPI‐labeled cells. c, d Quantification of colonies formed by transiently or stably transfected BT‐12 (c) and CHLA‐266 (d) cells following plating of 100 (BT‐12) or 500 (CHLA‐266) cells per 10 cm dish and 17 (BT‐12) or 24 (CHLA-266) days of incubation. e, f Cell cycle profiles of transiently transfected BT‐12 (e) and CHLA‐266 (f) cells. Cells were fixed and stained with propidium iodide (PI). DNA content was analyzed using flow cytometry. g, h To assess cells undergoing apoptosis, cells were stained with annexin V and PI and analyzed using flow cytometry. Shown are bar graphs representing the fold change in apoptotic cells following transient or stable KIF3A knockdown in the AT/RT cell lines BT-12 (g) and CHLA‐266 (h). Values shown represent mean ± SEM of three biologically independent replicates. ns: not significant, *p < 0.05; **p < 0.01; ***p < 0.001 (t-test).

