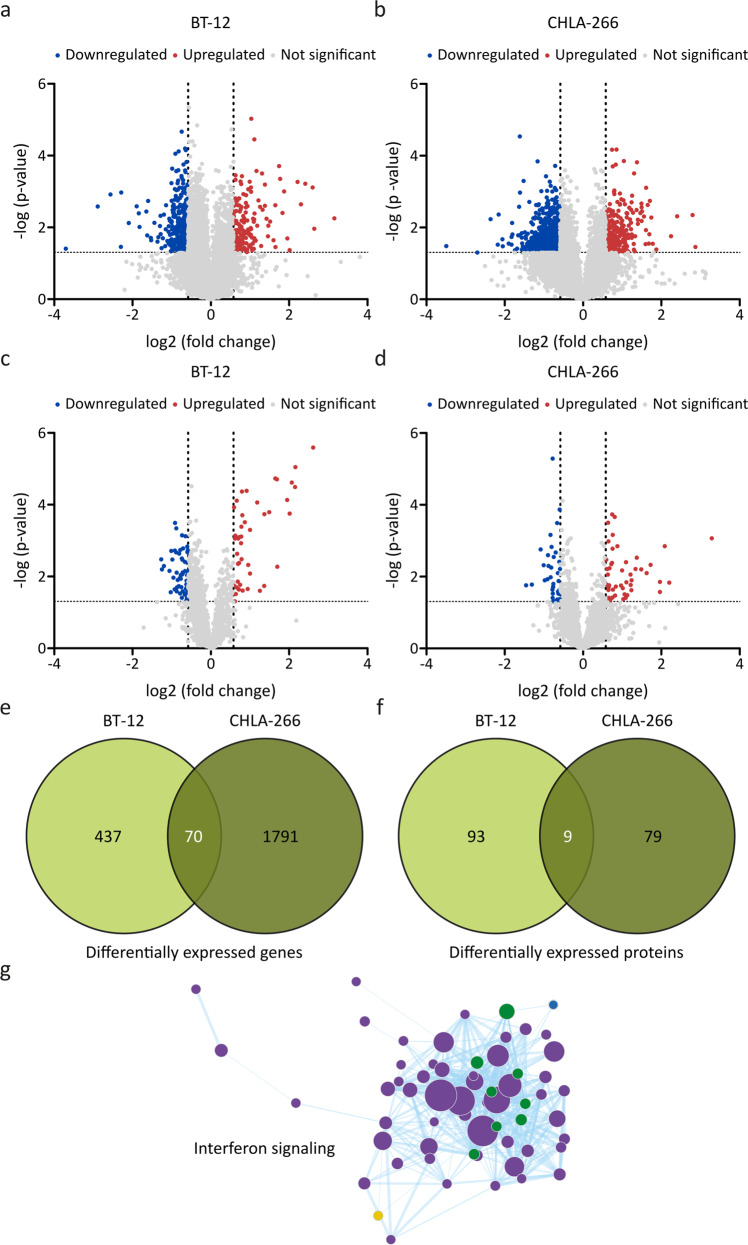
Fig. 4. Proteogenomic profiling reveals induction of interferon signaling following kinesin family member 3A (KIF3A) knockdown in the AT/RT cell lines BT‐12 and CHLA‐266.
a–d Volcano plots showing downregulated (blue dots), upregulated (red dots) and not significant (grey dots) transcripts (a, b) and proteins (c, d) following KIF3A knockdown in BT‐12 (a, c) and CHLA‐266 (b, d) cells, using a minimal fold change of ± 1.5 and a significance level of p < 0.05 as a cut‐off. Statistical analysis was performed using the non‐parametric Kruskal Wallis test. e, f Venn diagrams showing the overlap of differentially regulated genes (e) and proteins (f) between BT‐12 and CHLA‐266 cells. g Gene set enrichment analysis (GSEA) was performed for merged RNA sequencing and proteomics data. Green circles: Overlap between mass spectrometry (MS) and RNA sequencing (RS) upregulated in KIF3A knockdown cells. Purple circles: Upregulated in MS KIF3A knockdown cells. Blue circles: Upregulated in RS KIF3A knockdown cells. Yellow circle: Upregulated in MS control cells.

