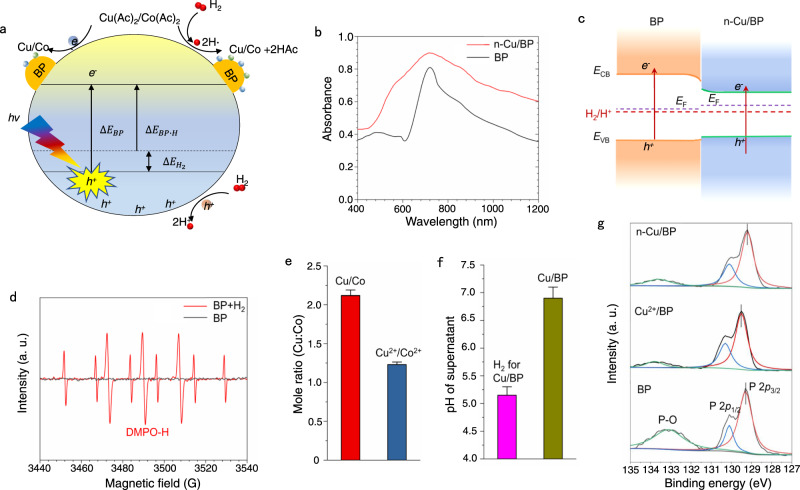
Fig. 3. Fundamental understanding of the synthesis process of electrocatalyst.
a Schematic diagram of photochemical induced M/BP synthesis. b UV/Vis DRS spectra. c Energy diagram of BP and n-Cu/BP, respectively) (EF respects Fermi level). d ESR spectra of the solutions obtained after 150 s of visible-light-induced reaction for H2 decomposition on BP. e Molar ratios of Cu to Co in M/BP (Cu/BP and Co/BP) and M2+/BP (Cu2+/BP and Co2+/BP), and box plots indicate median. f Change in pH after H2 was introduced into the NMP dispersion of Cu(Ac)2 and BP, and box plots indicate median. g P 2p XPS spectra of n-Cu/BP, Cu2+/BP, and BP.

