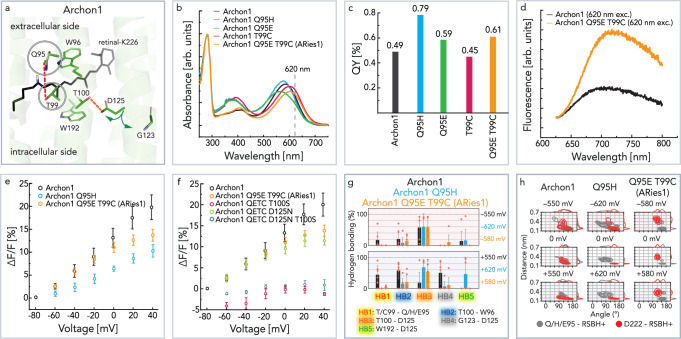
Fig. 6. Mutant studies of fluorescence increase.
a Retinal binding pocket highlighting mutated residues—Q95 and T99. b Absorption spectra of Archon1 and its D95X variants. c Fluorescence QY of Archon1 and its D95X variants. d Emission spectra of Archon1 and ARies1 with 620 nm excitation. Spectra presented in panels b–d have been recorded at RT, pH 8.0. e Voltage-dependent increase in fluorescence intensity of Archon1, Archon1-Q95H, and ARies1 under continuous 620 nm excitation, RT, pH 7.2 (Archon n = 14; Archon1-Q95H n = 4, p-value 0.049; ARies1 n = 8, p-value 0.010, the p-values are determined according to Wilcoxon–Mann–Whitney test (two-sided), Supplementary Fig. 22, Supplementary Table 3). f Voltage-dependent increase in fluorescence intensity of combinations of red-shifted and highly voltage-sensitive constructs (ARies1 n = 8; QETC-T100S n = 3, p-value 0.001; QETC-D125N n = 4, p-value 0.038; QETC-D125N-T100S n = 3, p-value 0.010, the p-values are determined according to Wilcoxon–Mann–Whitney test (two-sided), Supplementary Fig. 22, Supplementary Table 3). g Voltage-dependent probability of important hydrogen bonds in Archon1-Q95H (blue) and ARies1 (orange) compared to Archon1 (black) predicted by MD simulations using the same nomenclature as in Fig. 3 (the number of simulations for each voltage = 6). Data are presented as mean values ± SD. Each orange circle represents the data derived from the individual MD trajectories. h Distance and angle distributions between the RSBH+ and the two counterions Q95 (gray) and D222 (red) as observed by MD simulations at positive, zero, and negative transmembrane voltages in Archon1, Archon1-Q95H, and ARies1. g, h The MD simulations were conducted at 303 K by fixing the protonation states of titratable sites at neutral pH. Source data are provided in the Source Data file (b–h).

