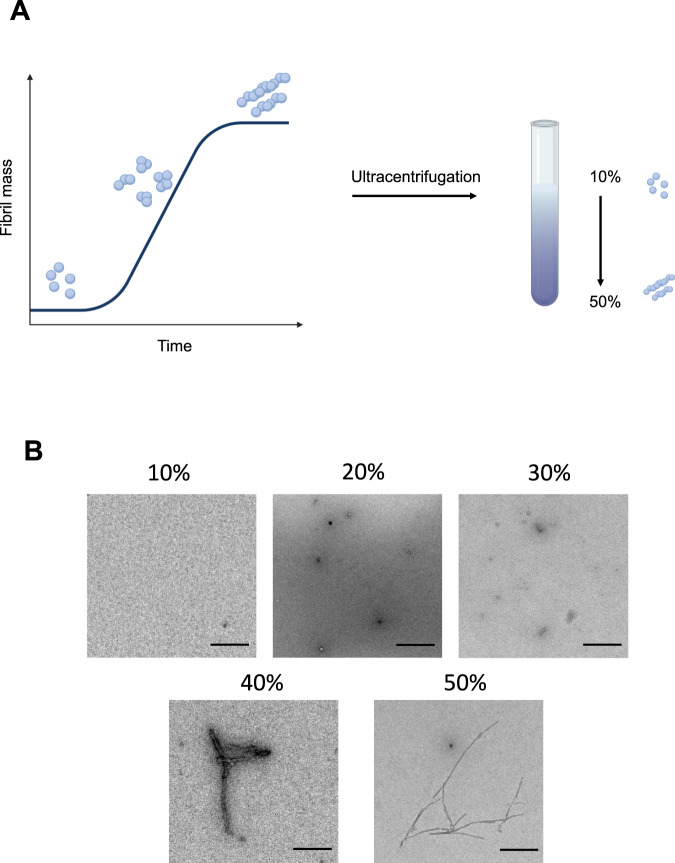
Fig. 1. Principle of protein separation by sucrose density centrifugation.
A Schematic representation of sucrose density centrifugation for a protein mixture. In vitro α-synuclein is aggregated and at specific time points aliquots are taken from the aggregation reaction. All time points are combined in a sucrose solution with increasing sucrose concentration (10, 20, 30, 40, and 50%, from top to bottom). The schematic has been created with BioRender.com. B Representative transmission electron micrograph images of aggregates present in individual fractions after density centrifugation. Scale bar = 200 nm. One out of two independent replicates represented here. Images were representative across experiments.

