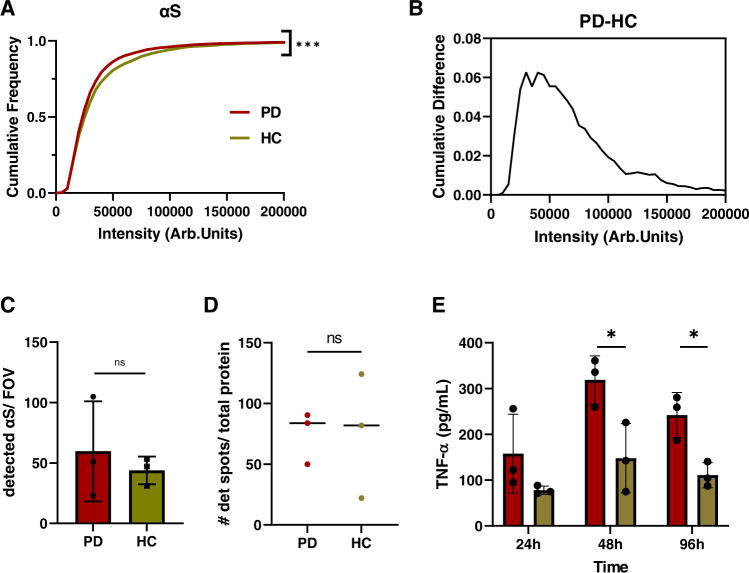
Fig. 8. Smaller aggregates in PD brains comprise α-synuclein and PD-derived aggregates induce a greater inflammatory response.
A Cumulative frequency distribution for α-synuclein aggregate intensity for PD (burgundy, N = 6866) and control (beige, N = 3157) measured using SiMPull with the epitope-specific SC antibody. Each histogram is the collected data from three cases. (Kolmogorov-Smirnoff, p < 0.001 for PD vs controls). B Cumulative difference for α-synuclein intensity for PD and controls, measured using SiMPull. C Number of detected α-synuclein aggregates per field of view for PD (N = 3) and controls (N = 3). Error bars are mean ± STD from three cases. (two-tailed unpaired t-test, p = 0.559, N = 3). Each point represents one of the three patients per group. D Scatter plot for the number of detected spots per field of view determined by AD-PAINT. Each point represents the mean value from different replicates for each of the three PD cases and controls and the line represents the median (two-tailed unpaired t-test from N = 3 per group, p = 0.971). The data are normalized to the total protein concentration determined by BCA. E TNF-α response from BV2 cells upon incubation with brain extracts over a distinct time course. The data are normalized to the total protein content determined by BCA. Error bars are mean ± STD from three patients per group. (two-tailed unpaired t-test, for 48 h p = 0.033 and for 96 h p = 0.016, N = 3 for PD and controls). Source data are provided as a Source Data file. Arb.Units = arbitraty units, # = Number, PD = Parkinson’s disease, HC = controls.

