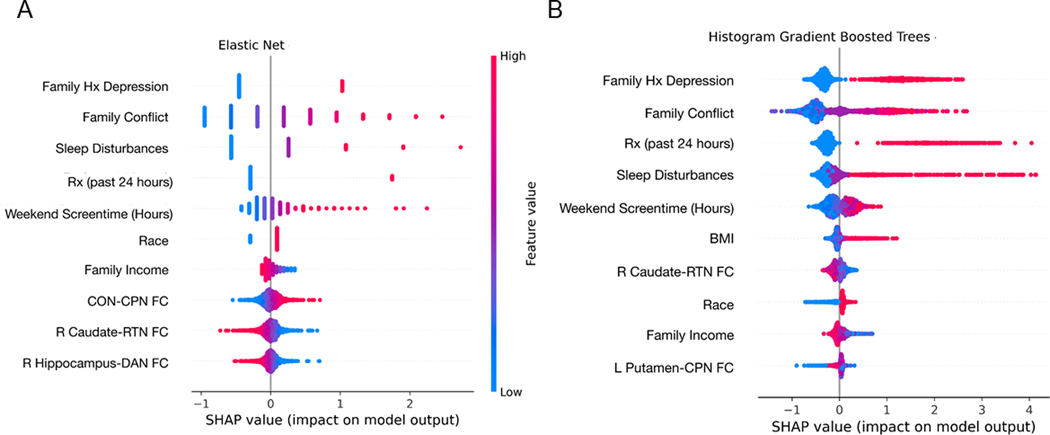
Figure 3. Shapley values of the top 10 features in the elastic net (A) and gradient boosted trees (B) models predicting 1-year follow-up depression symptoms.
The summary plots indicate the relationship between the value of a feature and the impact on the prediction, thus combining feature importance with feature effects. Each point on the summary plot is a Shapley value for a feature and an instance. The position on the y-axis is determined by the feature and on the x-axis by the Shapley value. The color represents the value of the feature from low (blue) to high (pink). The features are ordered according to their importance. See Figure S3 for a summary of the magnitude of Shapley values per feature in each model. BMI=body mass index; CON=cingulo-opercular network; CPN=cingulo-parietal network; FC=functional connectivity; Hx=history; RTN=retrosplenial temporal network; Rx=prescription medication

