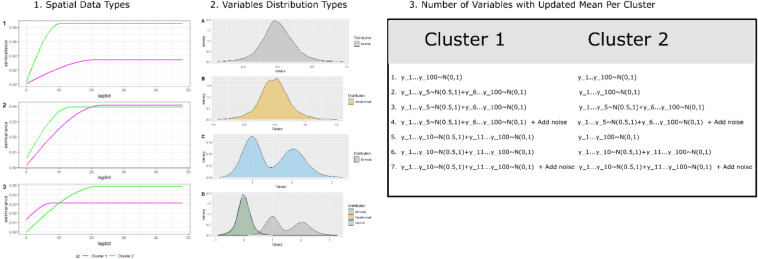
Figure 2.
The three main categories for synthetic data generation in a simulation study. (1) The synthetic data with different spatial structures were generated using different input in variogram function (spatial data1: range1 = 20, range2 = 20, sill1 = 0.1, sill2 = 0.3; spatial data2: range1 = 20, range2 = 10, sill1 = 0.1, sill2 = 0.1; spatial data3: range1 = 20, range2 = 10, sill1 = 0.1, sill2 = 0.3). (2) The variables in synthetic data are derived from different statistical distributions: normal, non-normal, bimodal, and all combined. (3) The synthetic data was modified by increasing the mean value for a certain number of variables and adding the noise.

