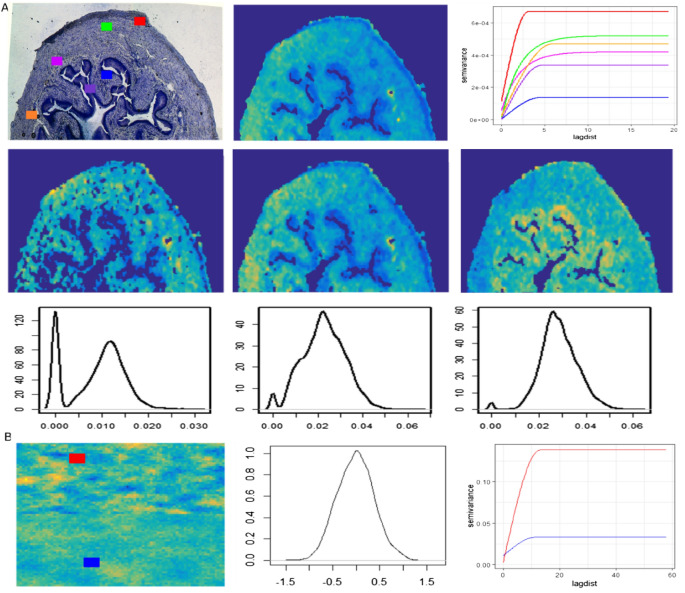
Figure 3.
Comparison of statistical (distribution) and spatial (variograms) properties of variables from real MSI (a) and synthetic spatial data (b). (A) Top row: The variograms (right) of an example single ion (middle) from different regions are shown in its histology image (left). Middle row: the 2D image of a few molecular ions from real MSI data and their density plot in the bottom row. (B) The synthetic spatial data image (left), density plot (middle), and the variograms (right) from synthetic data. The variograms (left column) and density plots (middle column) from synthetic data.

