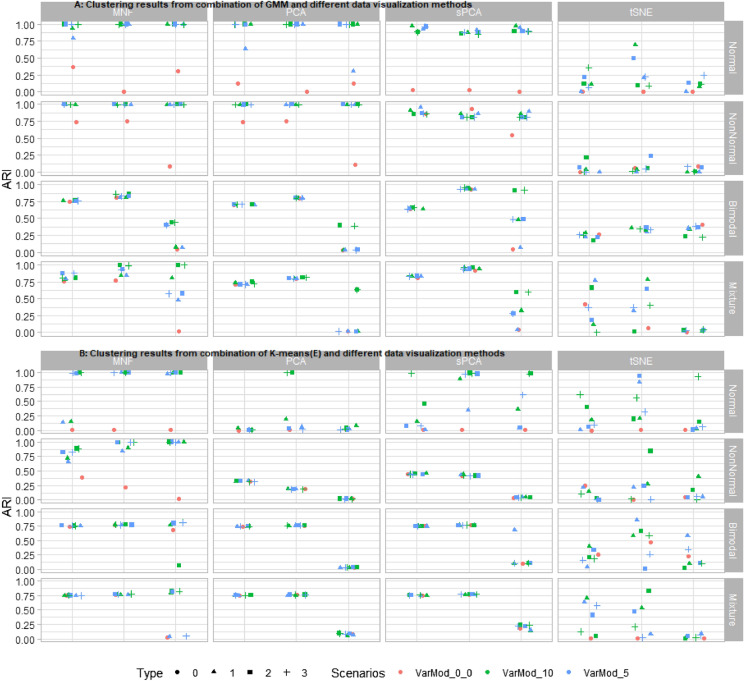
Figure 5.
A plot of simulation results from the combination of dimension reduction techniques and clustering methods. Four different dimension reduction techniques (MNF, PCA, sPCA, and t-SNE) were implemented on synthetic data before cluster analysis. Cluster analysis was performed with (A) GMM and, (B) Kmeans(E) methods. The performance of clustering methods is monitored based on their adjusted rand index (ARI) value. In the above figure, the ‘Scenarios’ represent the number of variables with updated mean values in synthetic data, such as VarMod_0, all variables in synthetic data with zero mean; VarMod_10, 10 variables in synthetic data with mean value 0.5; VarMod_5, 5 variables in synthetic data with mean value 0.5. And the ‘Type’ represents the nested conditions with scenarios (0, all variables with mean 0; 1, variables with updated means in single cluster (VarMod_0_5, VarMod_0_10); 2, variables with updated means in both clusters (VarMod_5_5, VarMod_10_10); 3, simulation with added noise (VarMod_5_5_addnoise, VarMod_10_10_addnoise). The details of the statistical and spatial parameters modified are given in Fig. 2.

