FIGURE 3.
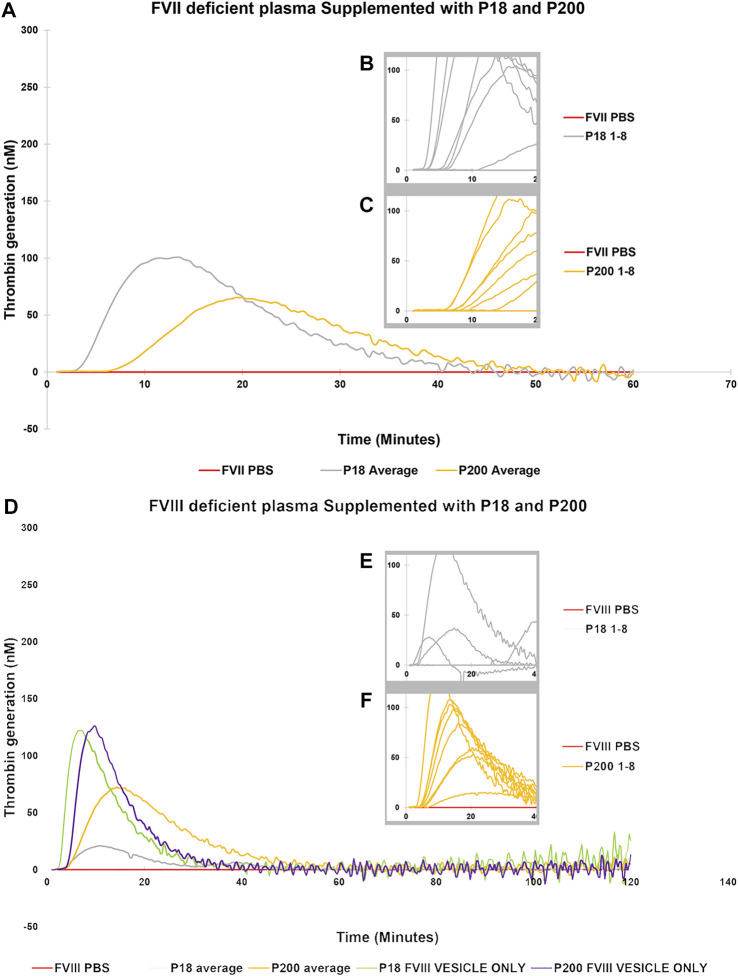
Thrombin Generation measured by Calibrated Automated Thrombogram (CAT®) is rescued in FVII and FVIII deficient plasmas by supplementation of urinary extracellular vesicles. EVs (P18 (Grey line, microvesicles) and P200 (Orange line, exosomes) were supplemented into FVII deficient plasma (A–C), and TG was measured after challenging the plasma with the PRP reagent (1pM TF without PLs). Similarly, P18 and P200 were supplemented into FVIII deficient plasmas (D–F), and TG was measured after challenging the plasma with PRP reagent. Diluted plasma (with PBS at same volume as EVs) was used a control (Red line). In A and B the averages at every time point for 8 measurements for both P18 and 8 P200 are shown. These 8 separate measurements are EVs (P18 and P200) purified from 8 individuals. The average is depicted to enhance clarity. Inset diagrams (B and C for FVII and E and F for FVIII) show a cut portion of the original diagram with 8 individuals’ measurements to highlight the differences in lag time (start of the TG) between the individuals (not evident in A and D). X-axis represents time and Y-axis TG in nM. Individual curves and statistics are described in Supplementary Figures S10, S11.

