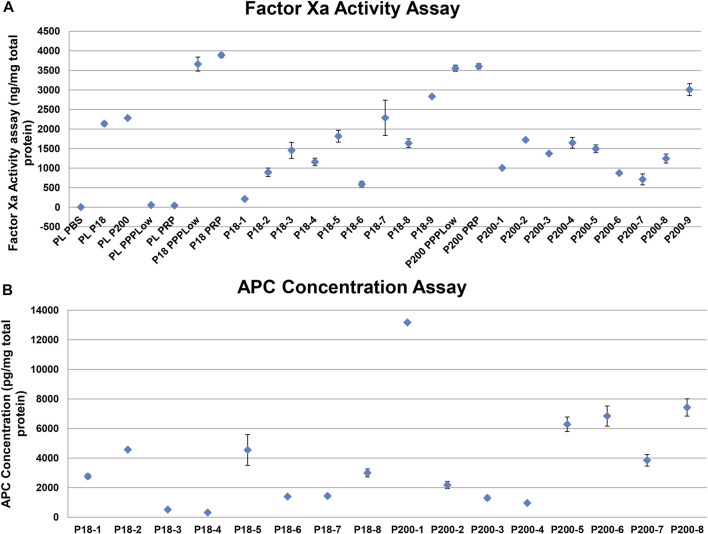
FIGURE 5.
Activity measurement of factor Xa and activated protein C shows variable but definite activity among individual samples. (A) Dot plot showing Factor Xa activity (with SD of triplicates) in various samples. PLPBS (Plasma diluted with PBS to same volume as EVs). PLP18 (Plasma diluted with P18 5:4 at P18 concentration of 50 µg/m). PLP200 (Plasma diluted with P200, 5:4 at P200 concentration of 50 µg/ml). PLPPPLow and PLPRP (diluted plasma with the PPPLow reagent and the PRP reagent at 4:1). P18 (Microvesicles without any addition), P200 (Exosomes without any addition), P18PPPLow and P18PRP (P18 supplemented with the PPPLow and the PRP reagent, respectively at 4:1). P200PPPLow and P200PRP (P200 supplemented with the PPPLow and the PRP reagent, respectively at 4:1). (B) Activated protein C (APC) activity in P18 (Microvesicles) per 1mg of total protein from 8 donors (P18-1 to P18-8), and the APC activity in P200 (Exosomes) per 1mg of total protein from 8 donors (P200-1 to P200-8), using the fluorescent substrate-based assay.

