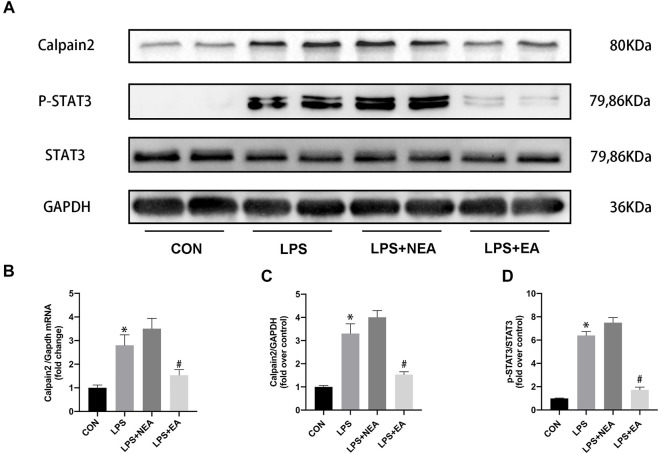
FIGURE 3.
Effect of EA pre-treatment on the expression of calpain-2/STAT3. (A) Representative blot images of proteins related to calpain-2/p-STAT3. (B) mRNA expression of Calpain-2. (C–D) Quantitative analysis of calpain-2 and p-STAT3 expression. N = 4 per group. EA, electroacupuncture; NEA, EA in non-acupoint; LPS, lipopolysaccharide. *p < 0.05 vs. control group, # p < 0.05 vs. LPS group.

