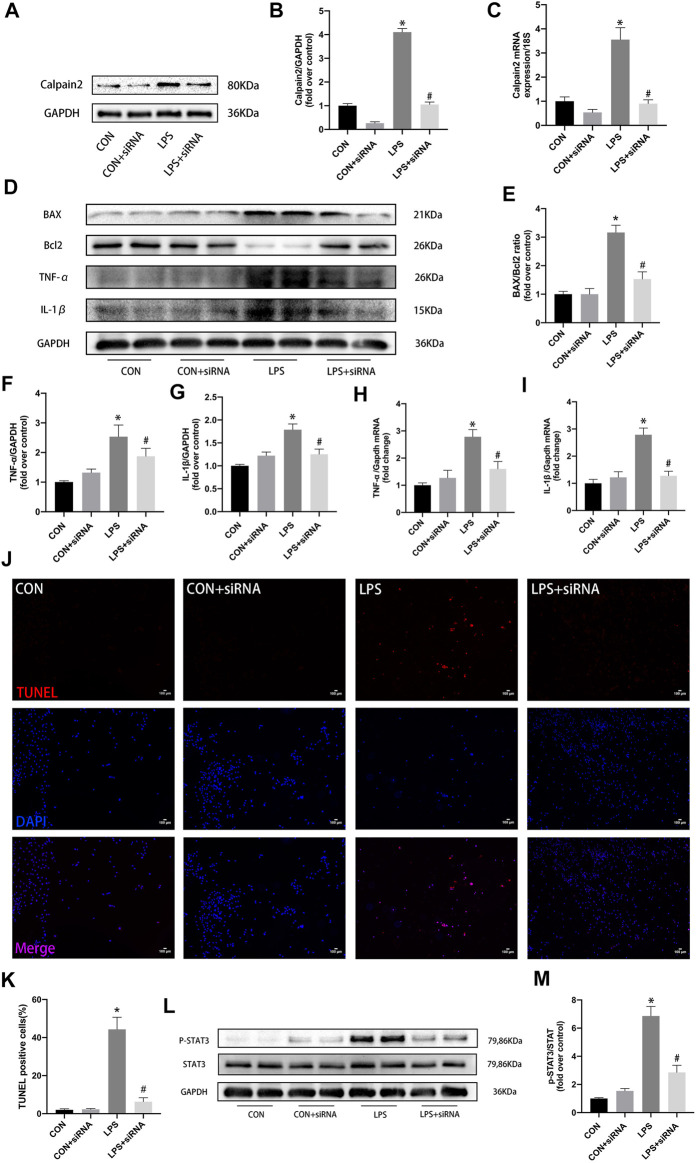
FIGURE 4.
Role of calpain-2 inhibition in the expression of proinflammatory factors, apoptosis, and p-STAT3 in LPS-induced cadiomyocytes. (A) Representative blot images of calpian-2 using calpain-2 siRNA. (B–C) The quantitative analysis of protein and mRNA expression of calpain-2. (D) Representative images of western blots for BAX,Bcl2,TNF-α and IL-1β. (E–G) The quantitative analysis of protein expression of BAX\Bcl2,TNF-α and IL-1β. (H–I) mRNA expression of Tnf-α and Il-1β in mouse heart. (J) TUNEL staining, apoptosis positive cells (red), nuclei (blue). (K) Quantitative analysis for TUNEL postive cells. (L) Representative images of western blots for P-STAT3, STAT3 and GAPDH. (M) Quantitative results of P-STAT3 to STAT3 total protein. N = 4 per group. *p < 0.05 vs. CON group, # p < 0.05 vs. LPS group.

