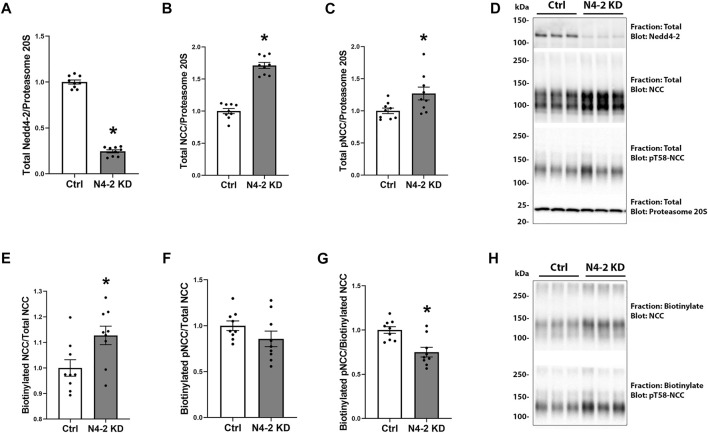
FIGURE 3.
Nedd4-2 deficiency increases total NCC levels and plasma membrane abundance. Semi-quantitative assessment of Nedd4-2 (A), NCC (B), and pT58-NCC (C) levels in total cell lysates of MDCKI-hNCC Ctrl and Nedd4-2 (N4-2) KD cell lines. Data are means ± S.E.M. (n = 9) *p < 0.05 assessed by unpaired Student’s t-test. (D) Representative blots of Nedd4-2, NCC, and pT58-NCC in total cell lysates of MDCKI-hNCC Ctrl and N4-2 KD cell lines. Semi-quantitative assessment of NCC (E), pT58-NCC (F) and the NCC/pT58-NCC ratio (G) in membrane fractions of MDCKI-hNCC Ctrl and Nedd4-2 (N4-2) KD cell lines. Data are means ± S.E.M. (n = 9) *p < 0.05 assessed by unpaired Student’s t-test. (H) Representative blots of NCC and pT58-NCC in membrane fractions of MDCKI-hNCC Ctrl and N4-2 KD cell lines.

