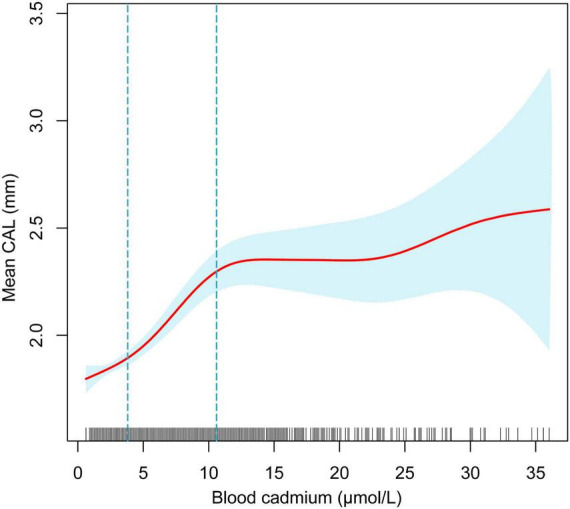
FIGURE 2.

The non-linear relationship between blood cadmium and mean CAL. The blue area represents the 95% confidence interval. The red line represents point estimates. Age, sex, race/ethnicity, BMI, income-poverty ratio, education, vitamin D, smoking status, diabetes, frequency per week using floss and mouthwash, periodontal treatment, hypertension, hyperlipidemia, BMD, congestive heart failure, coronary heart disease, angina pectoris, heart attack, stroke, physical activity, and calcium intake were adjusted.
