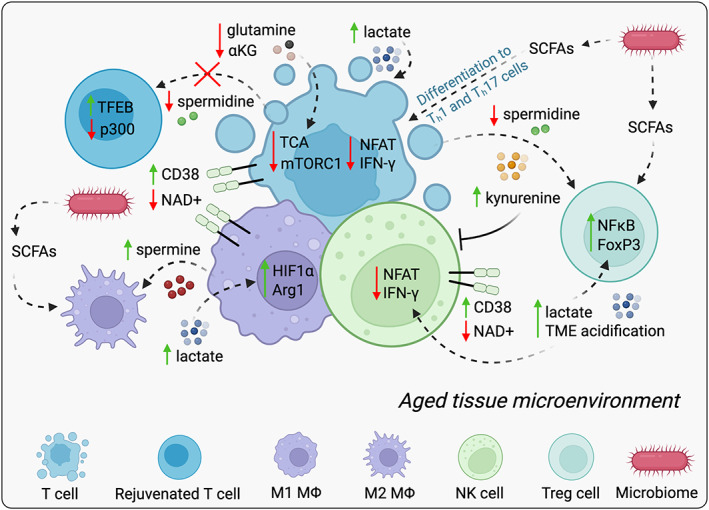
Fig. 2.

Aging‐induced metabolic suppression of host defenses. Age‐induced metabolic alterations shape both innate and adaptive immunity resulting in a decline in immune cell activation and proper immune responses. Aging promotes a global decline in NAD+ within the immune compartment due to an increase in the expression of NADase CD38 leading to a decline in cytotoxic effector activity and the induction of an inflammatory state. The decline in glutamine and ɑ‐KG availability with age further negatively impacts the function and differentiation of T cells by limiting substrate availability for TCA anaplerosis and redox reactions. The age‐induced decline in spermidine inhibits autophagy in T cells and disrupts the homeostatic differentiation of CD4+ T cells into specific subsets. On the other hand, aging also induces lactate production and promotes acidification; this acidification reduces the activity of NFAT and IFN‐γ in T cells and NK cells inhibiting their cytotoxic ability and induces protumorigenic M2‐like polarization of macrophages via stabilization of HIF‐1α and induction of Arg1 expression. Similarly, age‐induced elevation in spermine levels favors polarization towards a protumorigenic M2 macrophage phenotype, both dampening the immune response. In addition, lactate contributes to immunosuppression by promoting an activation of Treg phenotype of CD4+ T cells through NF‐kB and FoxP3 activity. This phenomenon can also be controlled by the age‐induced increase in kynurenine, which blocks the cytotoxic activity of T and NK cells. Advanced age might also cause a shift in microbiome composition affecting SCFAs in old hosts and thereby influence antitumor immunity. SCFAs have been shown to regulate innate immune cells via decreasing the secretion of proinflammatory cytokines by macrophages. On the other hand, SCFAs tend to enhance the polarization effects set by the cytokine milieus present at the time of T‐cell priming and differentiation. Green and red arrows indicate increased or decreased level, respectively. ɑ‐KG, α‐ketoglutarate; Arg1, arginase 1; CD38, cluster of differentiation 38; FoxP3, forkhead box P3; HIF‐1 α, hypoxia‐inducible factor 1α; INF‐γ, interferon‐gamma; M1MΦ, M1‐polarized macrophages; M2MΦ, M2‐polarized macrophages; mTORC1, mechanistic target of rapamycin complex 1; NAD, nicotinamide adenine dinucleotide; NFAT, nuclear factor of activated T cells; NF‐kB, nuclear factor‐kappa B; NK cell, natural killer cell; p300, histone acetyltransferase p300; SCFAs, short‐chain fatty acids; TCA, tricarboxylic acid; TFEB, transcription factor EB; Treg, regulatory T. [Colour figure can be viewed at wileyonlinelibrary.com]
