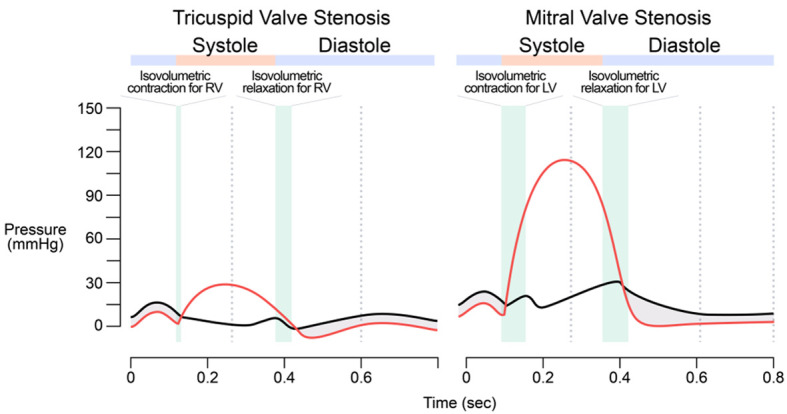
Figure 4.

Wigger’s diagrams showing changes from Tricuspid Valve Stenosis and Mitral Valve Stenosis. The pressure gradient (shaded areas) between the right atrial pressure (RAP) and the right ventricular pressure (RVP) during a cardiac cycle in a patient with tricuspid stenosis is inferred from and compared to the pressure gradient in mitral stenosis.
