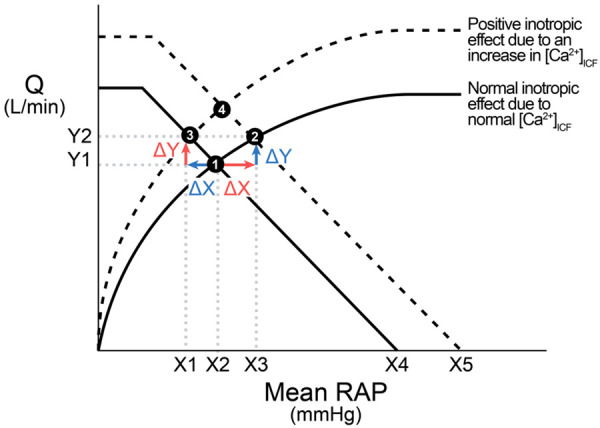
Figure 6.

Interpretation of the combination of the Levy’s vascular function curve (VFC) and the cardiac function curve (CFC). From ❶ to ❷: An increase in the mean RAP as the IV (the red ∆X) causes two changes: an in-line increase (blue ∆Y as the DV) in the CFC due to Frank-Starling mechanism and a shift of the VFC from the solid VFC to the dashed VFC. The blue ∆Y does not cause any decrease in the mean RAP. This method of analysis can be applied to the change from ❸ to ❹. From ❶ to ❸: In contrast, the red ∆Y (i.e., ∆Y as the IV, an in-line change in the VFC) causes a decrease in the mean RAP and the shift of the CFC upward. This method of analysis can be applied to the change from ❷ to ❹.
