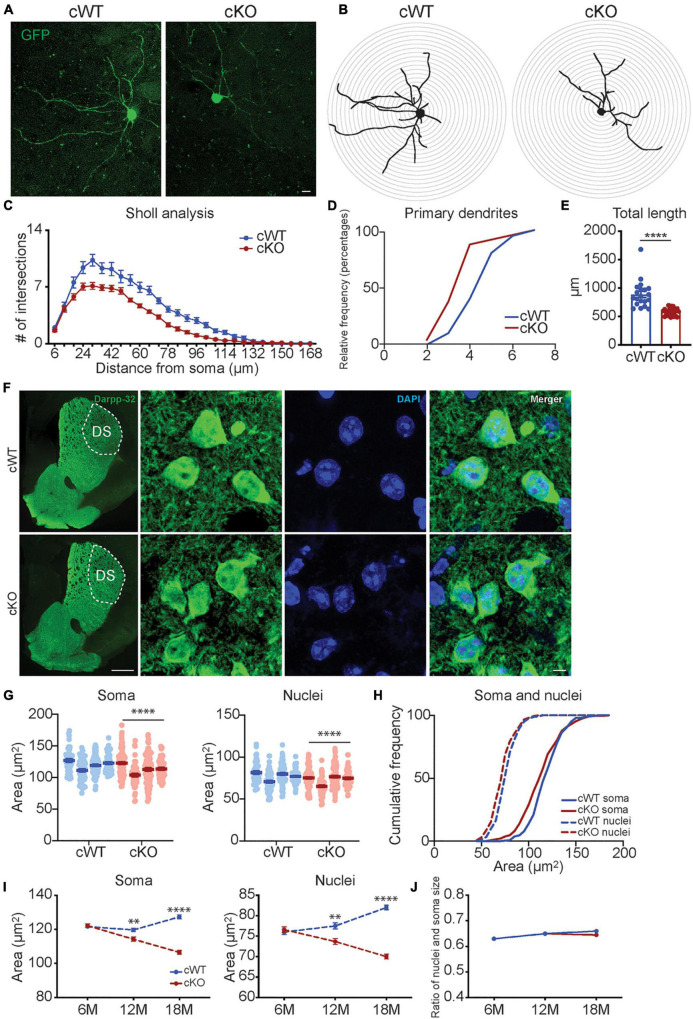
FIGURE 3.
Analyses of neuronal morphology in Pitx3cKO mice during aging. (A) The GFP-labeled individual MSN in 12-month-old Pitx3cWT and Pitx3cKO mice (scale bar: 10 μm). (B,C) Sholl analysis of dendritic complexity of GFP-labeled MSNs in 12-month-old Pitx3cWT and Pitx3cKO mice (N = 3 mice per genotype; 5–8 neurons per mouse were counted). Benjamin- Hochberg multiple comparison test of dendritic complexity at 18, 24, 30, 36, 42, 54, 60, 66, 72, 78, 84, 90, 96, 102, 108, and 114 μm from soma, q ≤ 0.05. (D) Analyses of primary dendrites (N = 3 mice per genotype; 5–8 neurons per mouse were counted; all males). (E) Dendritic length of GFP-labeled MSNs in 12-month-old Pitx3cWT and Pitx3cKO mice (N = 3 mice per genotype; 5–8 neurons per mouse were counted) unpaired t-test, ****p < 0.0001. (F) Co-staining of Darpp32 and DAPI in MSNs of 12-month-old Pitx3cWT and Pitx3cKO mice (scale bar: 500 μm; high-magnification, 5 μm). (G) The soma and nucleus size of MSNs in 12-month-old Pitx3cWT and Pitx3cKO mice (N = 4 mice per genotype; all males). Conditional logistic regression test, ****p < 0.0001. (H) Cumulative frequency of the soma and nuclear size distribution in MSNs of 12-month-old Pitx3cWT and Pitx3cKO mice. (I) The soma and nucleus size of MSNs in Pitx3cWT and Pitx3cKO mice at 6 (N = 4 mice per genotype; all males), 12 (N = 4 mice per genotype; all males) and 18 months (N = 3 mice per genotype; all males) of age. 2way ANOVA analysis with Sidak’s multiple comparisons test, **p = 0.0075 (soma, 12 months), ****p < 0.0001 (soma, 18 months), **p = 0.0022 (nuclei, 12 months), ****p < 0.0001 (nuclei, 18 months). (J) The nuclear size and soma size ratio (N/C ratio) of MSNs in Pitx3cWT and Pitx3cKO mice. DS, dorsal striatum.

