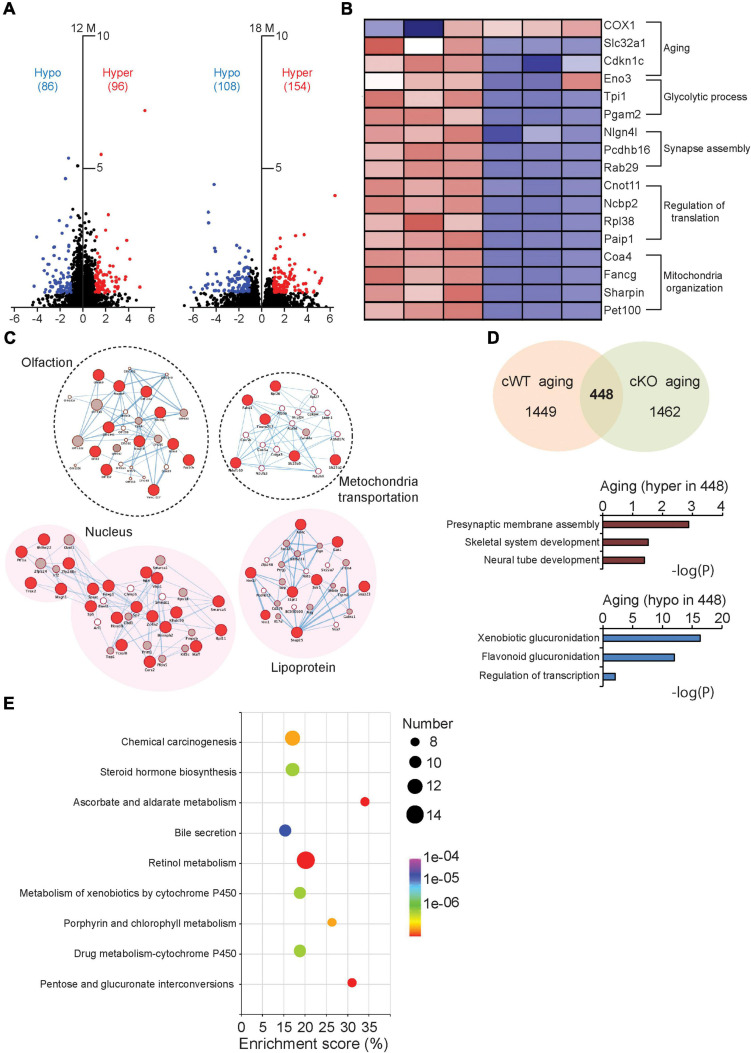
FIGURE 5.
Comparative analysis of the DMGs in Pitx3cWT and Pitx3cKO during aging. (A) The volcano plots of DNA methylation data collected from the striatum of Pitx3cWT and Pitx3cKO mice at 12 (N = 3 mice per genotype; all males) and 18 months of age (N = 3 mice per genotype; all males). (B) Supervised clustering for the DMGs data collected from the 12- and 18-month-old Pitx3cWT mice. (C) Integrated map of GO terms enriched among the DMGs of Pitx3cWT and Pitx3cKO mice at 12 (background with white color) and 18 months of age (background with pink color). Red circles represented DMGs identified from our data. (D,E) 448 DMGs were identified during aging independent of genotype. They were analyzed with GO terms (D) and metabolic pathway (E), respectively.

