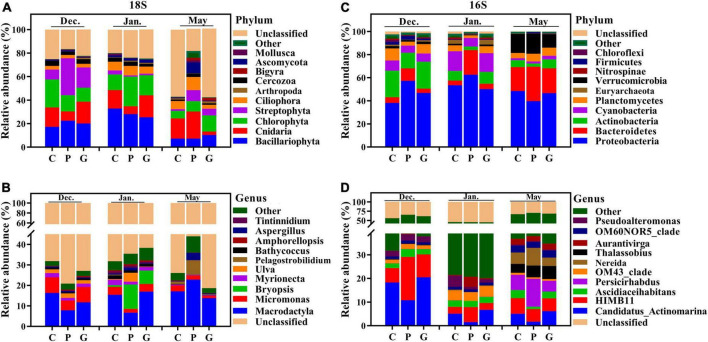
FIGURE 3.
Microbial community composition across different cultivation periods at the three study sites. Relative abundance of different phyla (A) and genera (B) based on 18S and different phyla (C) and genera (D) based on 16S in the 39 samples. The abundances are presented in terms of percentages of total effective sequences in a sample at the different levels.

