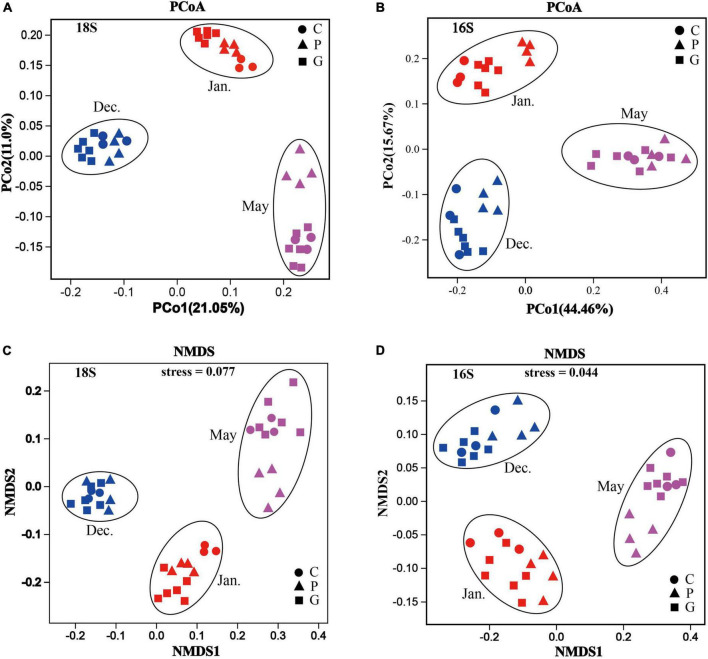
FIGURE 4.
Microbial community structures and identification of patterns based on Bray–Curtis distances in different zones during the various cultivation stages. Principal coordinates analysis (PCoA) plot: all samples (zones C, P, and G) taken in different months based on 18S rRNA genes (A) and 16S rRNA genes (B) of all the OTUs. Non-metric multi-dimensional scaling analysis (NMDS) plot: all samples (areas C, P, and G) taken in different months based on 18S rRNA genes (C) and 16S rRNA genes (D) of all the OTUs.

