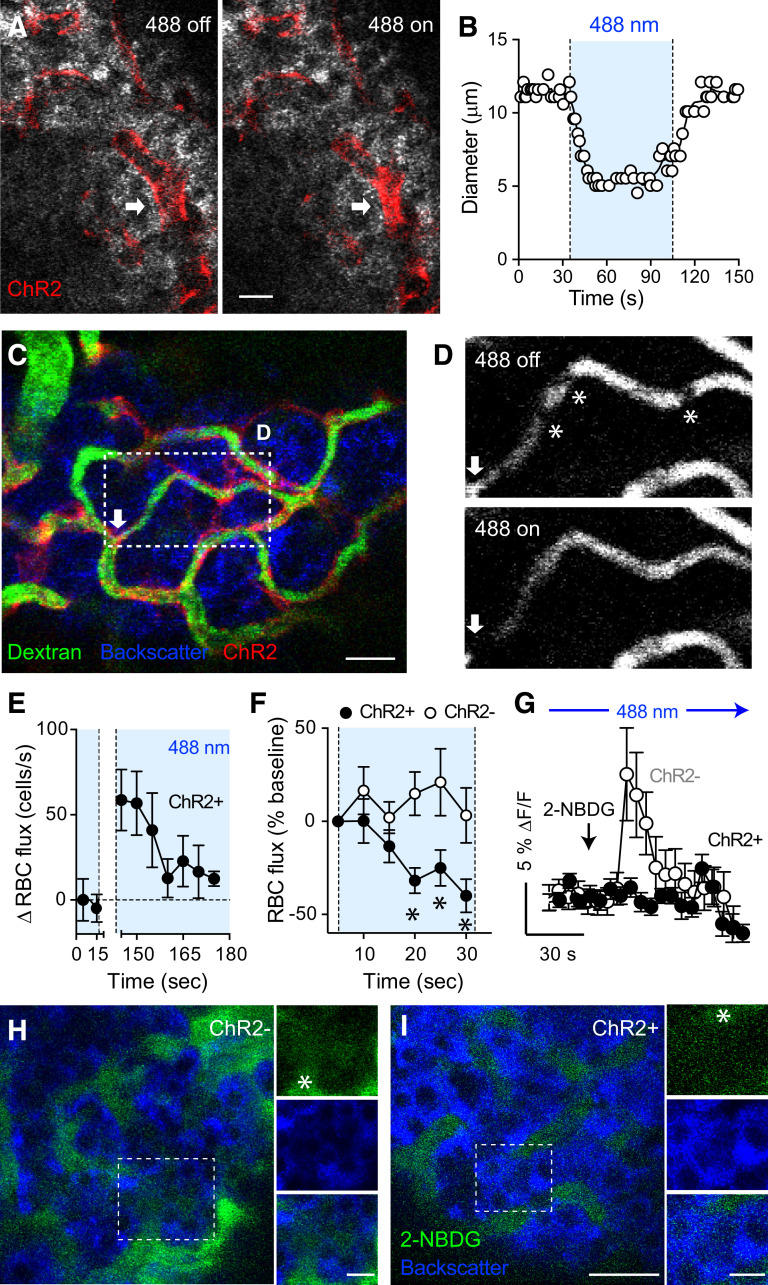
Figure 3.
Optogenetic activation of islet pericytes constricts capillaries, decreases blood flow, and limits perfusion of the islet. A and B: Confocal images taken during in vivo imaging of an intraocular islet graft show that activating ChR2-expressing pericytes with blue light (488-nm laser) constricted an islet capillary (arrow; changes in diameter are plotted in B). C: In vivo confocal image of an islet graft showing islet vessels (dextran, green) and ChR2-expressing pericytes (red). Arrow indicates a potential “sphincter” pericyte. D: Blood flow through an islet graft capillary (region within rectangle in C) is reduced upon turning on the 488-nm laser. Asterisks indicate different RBCs (shadows). E: Quantification of changes in RBC flux over time in an NG2-ChR2+ islet graft (RBC flux − baseline values are shown). The 488-nm laser had been on for 1 min before starting in vivo recording and was turned off from t = 20–140 s. RBC density was estimated in 5-s intervals (n = 7 vessels). F: Relative changes in RBC flux in capillaries in islet grafts from NG2-ChR2+ (black symbols) and NG2-ChR2− mice (white symbols) induced by the 488-nm laser (n = 14–24 vessels per three mice in each group). *P < 0.05 by multiple t test. G: Quantification of changes in 2-NBDG fluorescence intensity in regions within the islet parenchyma as shown in H and I (fluorescence levels in the islet graft were normalized to those in the aqueous humor; arrow indicates time of injection). H and I: Diffusion of the fluorescent glucose analog 2-NBDG (5 mg/kg i.v.) was reduced by optogenetic stimulation started at 30 s before glucose injection. In vivo images of 2-NBDG fluorescence (green) in islet grafts from NG2-ChR2− (H) and NG2-ChR2+ (I) mice 30 s after injection. Asterisk indicates blood vessels. Data are mean ± SEM (E–G). Scale bars = 10 μm (A) and 20 μm (C, H, and I).

