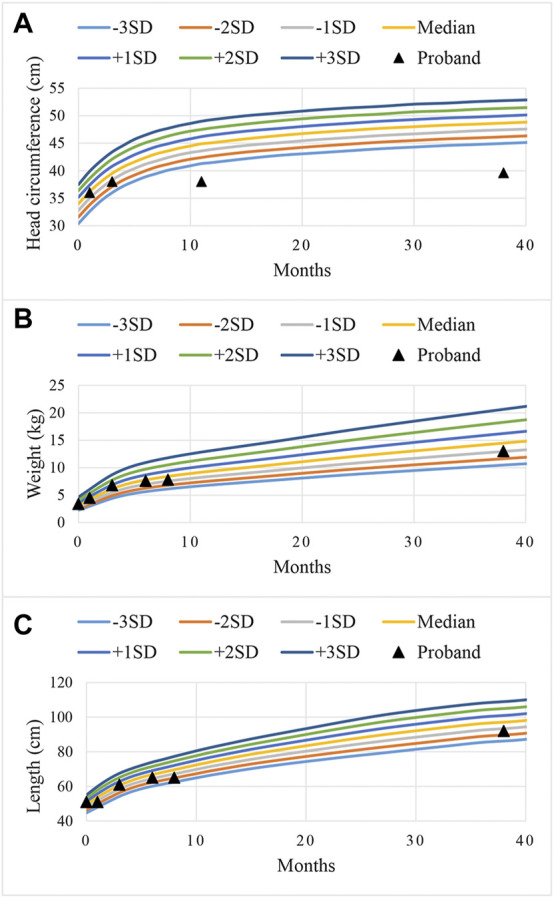
FIGURE 1.

Curves of standard deviations (SD) during the growth of head circumference (A), weight (B), and length (C) for the proband. The color curves were the referenced growth curves for Chinese girls, and the black triangles were the growth status of the proband at different ages.
