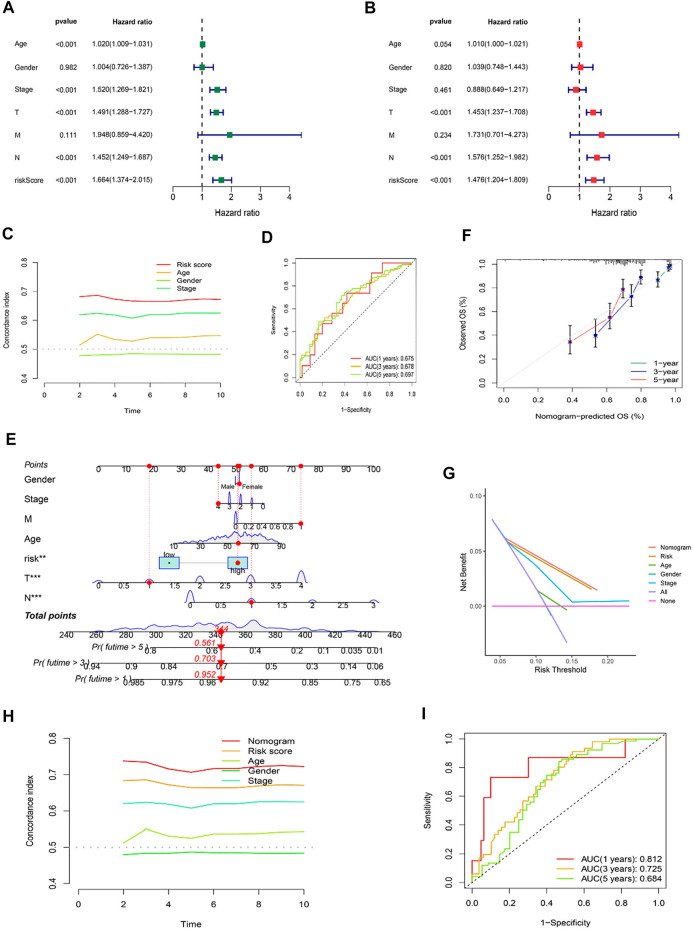
FIGURE 6.
Independent Prognostic Factors and Construction of Nomogram. Forrest plot of the univariate Cox regression analysis (A), and multivariate Cox regression analysis (B), based on the entire set. (C) The concordance index of risk score with clinical characteristics. (D) ROC curves for 1-, 3-, and 5-years OS in the risk model. (E) The nomogram. (F) The calibration curves of the nomogram predict the probability of the OS (The x-axis shows nomogram-predicted survival, and the y-axis shows actual survival. The grey line shows the ideal calibration line, and the color line represents the model-predicted calibration line. (G) The DCA curves of the nomogram. (H) The concordance index of nomogram, risk score and clinical characteristics. (I) ROC curves for 1-, 3-, and 5-years OS in the nomogram.

