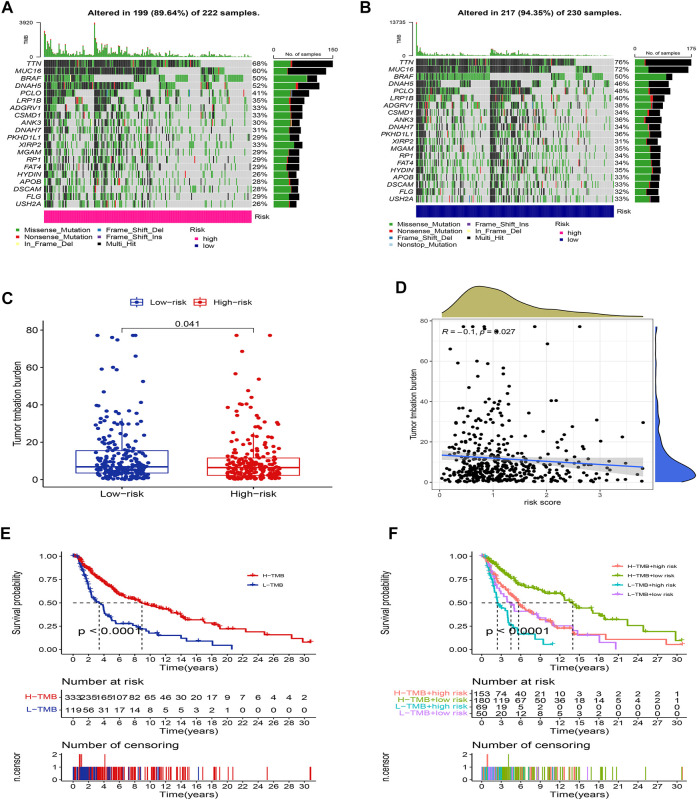
FIGURE 9.
Landscape of mutation between two groups. The mutation distributions of patients in the high-risk group (A), and low-risk group (B). (C) The difference in TMB score between the two groups. (D) Correlations between risk score and TMB. (E) K-M analysis of the OS between high- and low-TMB groups. (F) K-M analysis of the OS between four groups stratified by both TMB and risk score.

