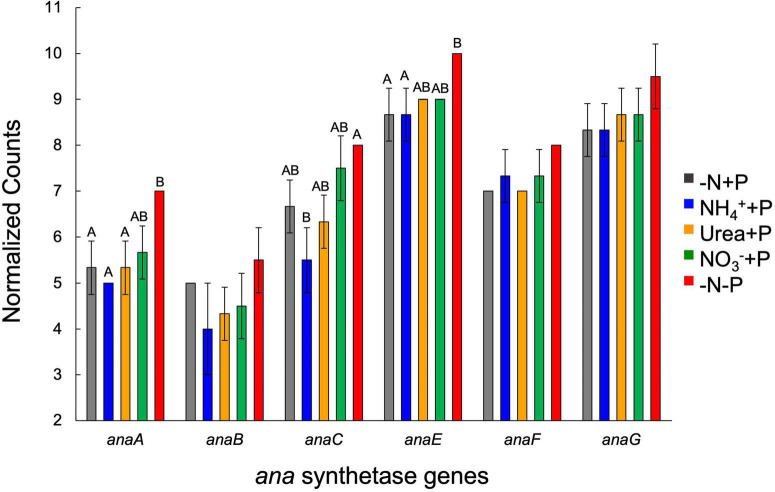
FIGURE 10.
Expression (normalized counts) of genes involved in anatoxin synthesis across treatments at the final timepoint (day 9). Error bars represent standard deviation. Letters above bars represent significant differences between experimental groups (Two-way ANOVA; Tukey’s HSD post hoc; p < 0.05).

