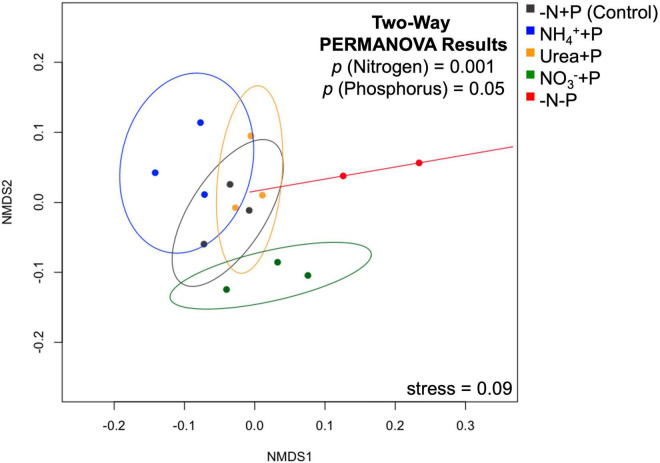
FIGURE 5.
Non-metric multi-dimensional scaling (nMDS) plot of normalized read counts among treatments mapped to the Trinity assembly. Stress value in the lower left-hand corner indicates the disagreement between the plot configuration and the predicted values from the regression. Ellipses represent 95% confidence intervals, with the results of a two-way PERMANOVA (p < 0.05) on the dissimilarity matrix of the data presented in the upper right-hand corner, representing the significance of fixed nitrogen and phosphorus availability on relative differences.

