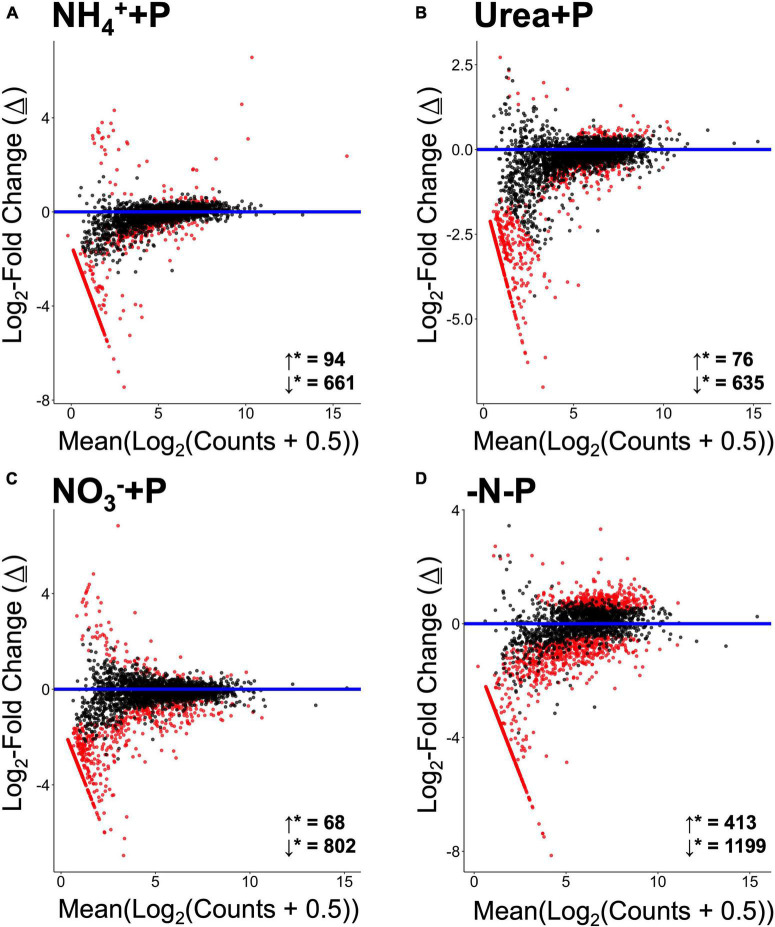
FIGURE 6.
MA plots representing log2-fold changes (Δ) in gene expression of experimental treatments [(A) = NH4+ + P, (B) = Urea + P, (C) = NO3– + P, (D) = −N-P) relative to the control (−N + P). Change is plotted relative to base mean expression of gene transcripts normalized, log2-transformed, annotated and aggregated relative to KO numbers. Significantly differentially upregulated (↓*) genes and downregulated (↓*) genes are indicated directly above the x-axes. Gene transcripts exhibiting statistically significant differences in expression (False Discovery Rate/qval < 0.05) are colored red. Statistical analyses were performed in Sleuth using the Wald test.

