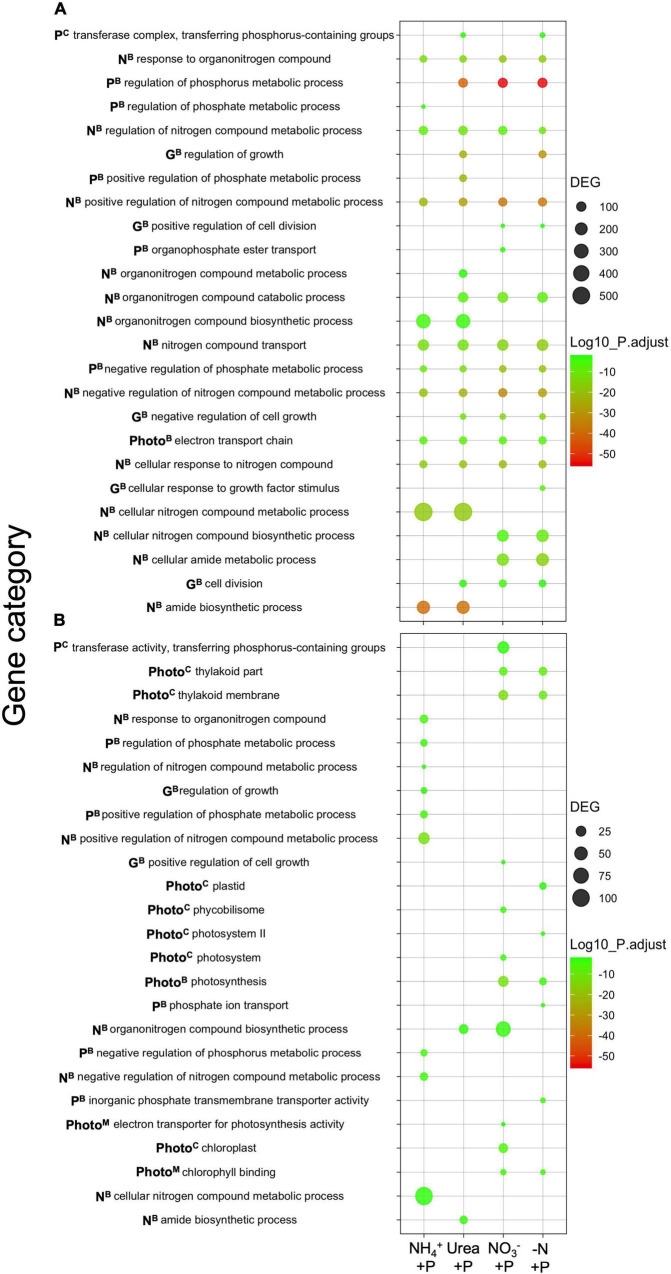
FIGURE 7.
Differentially expressed categories of genes [(A) = 4-fold downregulated, (B) = 4-fold upregulated] relative to the control (−N + P). Results are from transcript-based Gene Ontology (GO) enrichment analysis. The significant differential expression of genes was determined using Sleuth (Wald test; qval < 0.05), and gene categories were tested for significant differential expression using GOenrich (hypergeometric distribution analysis; padj < 0.05). Padj values were Log10-transformed for scaling purposes, and green - red colorations corresponded to lower - higher degrees of significance. Gene categories plotted were those associated with nitrogen (N) and phosphorus (P) assimilation, growth (G), as well as photosynthesis (Photo), while superscripts correspond to biological (B), cellular (C), and molecular (M) gene categories. The number of differentially expressed genes (DEGs) in gene categories are represented by circle size.

