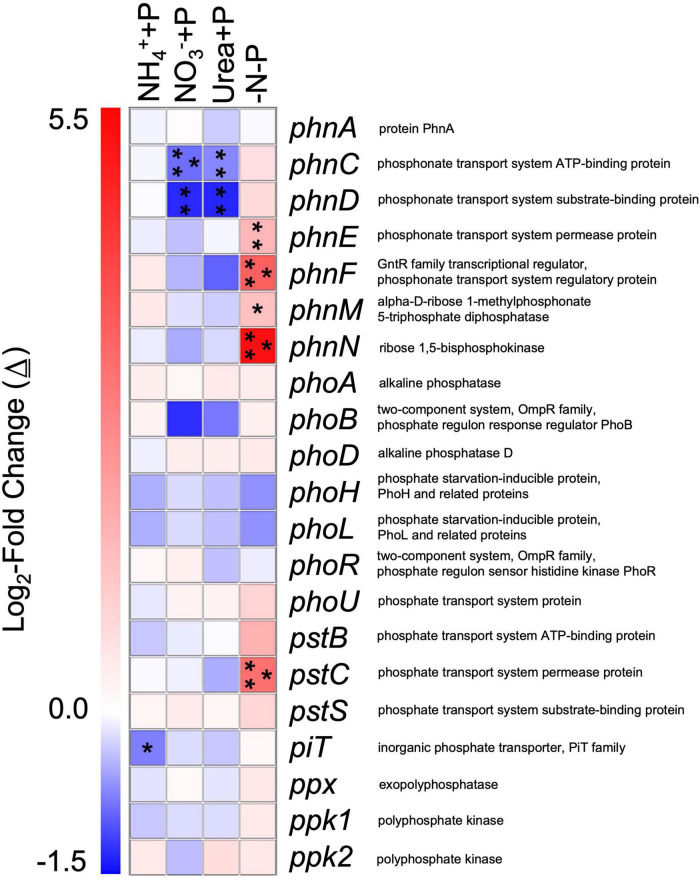
FIGURE 9.
Differential expression of gene transcripts associated with phosphorus acquisition and metabolism in experimental groups relative to the control/−N + P. Heatmap representing log2-fold changes (Δ) in phosphorus metabolism/acquisition gene expression in experimental groups with their corresponding gene products. Red or blue coloration corresponds to up or down – regulation of genes relative to the control, respectively. Statistical analyses were determined on transcriptomic data post-Sleuth analysis using the Wald test (qval < 0.05 = *, 0.01 = **, 0.001 = ***).

