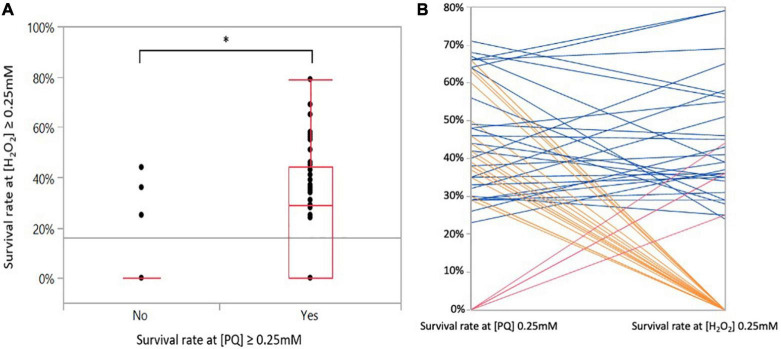
FIGURE 2.
Correlations between superoxide and hyperoxide stress responses. (A) Survival rate of the 83 C. jejuni strains exposed at 0.25 mM H2O2 as a function of their survival to 0.25 mM PQ. Statistical significance was determined using the ANOVA test (*p ≤ 0.05). (B) Relationship between survival at 0.25 mM PQ and H2O2. The parallel coordinates indicate strains that show similar survival responses or not to both stresses. Each line corresponds to a strain exposed to PQ (left y-axis) and to H2O2 (right y-axis). Blue lines correspond to strains surviving both stresses at a concentration of 0.25 mM (n = 27), orange lines to strains surviving at 0.25 mM of PQ but not at 0.25 mM H2O2 (n = 20), and red lines to strains surviving at 0.25 mM H2O2 but not at 0.25 mM PQ (n = 4).

