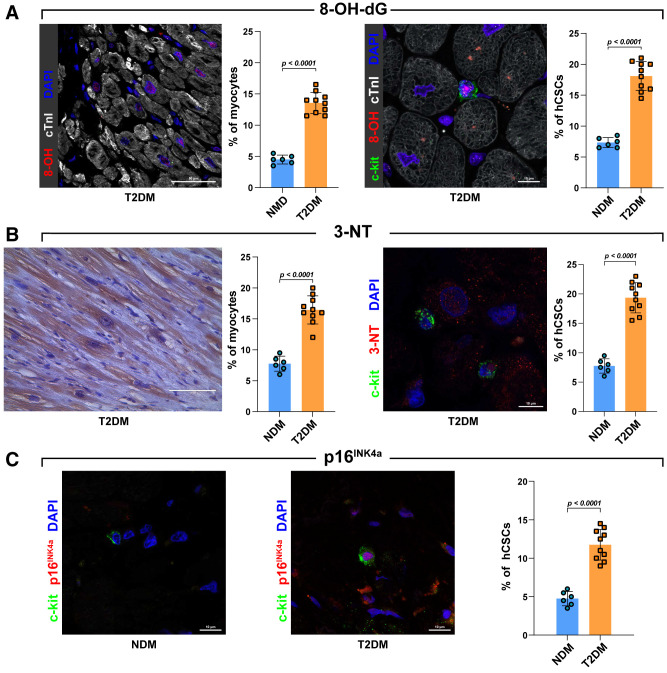
Figure 2.
Quantification of oxidative stress and senescent markers in myocytes and progenitor cells. A: Representative confocal images and bar graphs showing 8-OH-dG–positive cardiomyocytes and 8-OH-dG–positive hCSCs in LV samples obtained from patients with T2DM (8-OH-dG, red; c-kit, green; cTnI, white; DAPI, blue; n = 10 and 6 T2DM and NDM heart sections, respectively). Scale bars = 50 μm and 10 μm, respectively. B: Representative light microscopy, confocal image, and bar graphs showing 3-NT–positive cardiomyocytes (brown) and 3-NT–positive hCSCs in LV samples obtained from patients with T2DM and NDM (3-NT, red; c-kit, green; DAPI, blue; n = 10 and 6 T2DM and NDM heart sections, respectively). Scale bars = 100 μm and 10 μm, respectively. C: Bar graph and representative confocal images showing p16INK4a expression in LV T2DM-hCSCs compared with NDM-hCSCs (p16INK4a, red; c-kit, green; DAPI, blue; n = 10 and 6 T2DM and NDM heart sections, respectively). Scale bars = 10 μm. Data are mean ± SD.

