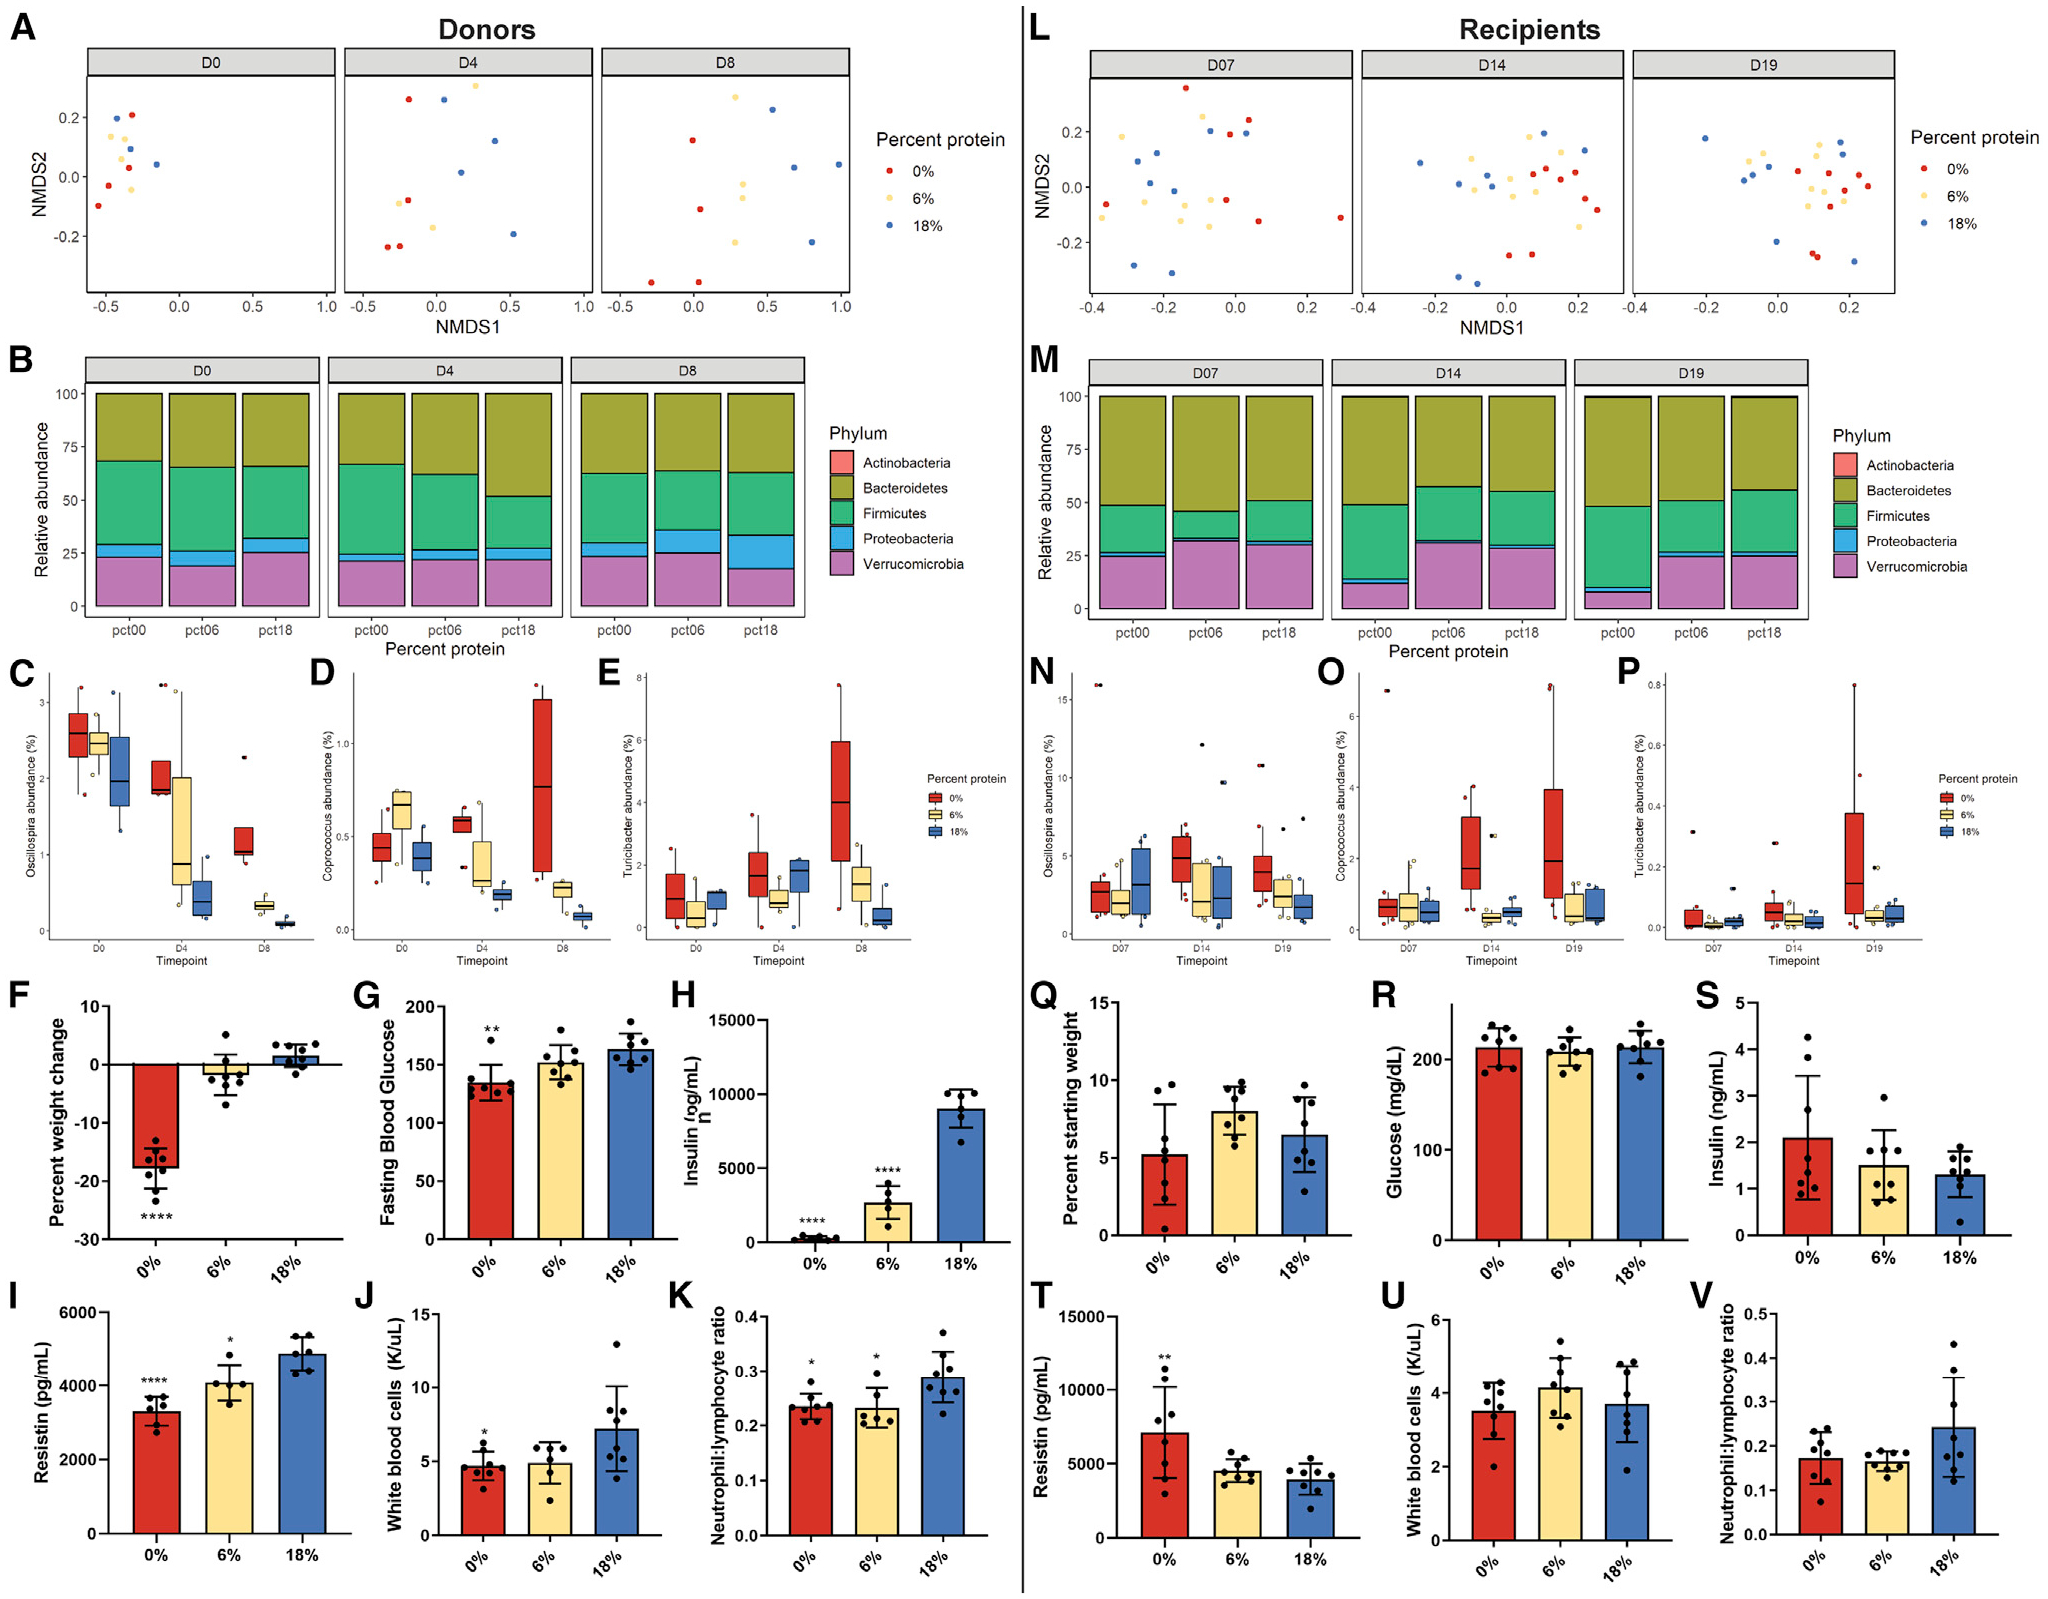
Figure 2. Effects of dietary protein titration on fecal microbiome composition.

(A and L) NMDS plots after (A) 0, 4, and 8 days of diet in donor mice and (L) 7, 14, and 19 days after inoculation of gnotobiotic recipient mice.
(B and M) Relative abundance of the 5 most abundant phyla in fecal samples from (B) donor mice and (M) recipient mice across the time courses.
(C–E and N–P) Relative abundances of the genera Oscillospira, Coprococcus, and Turicibacter across the time course in (C–E) donor and (N–P) recipient mice. (F–K) Percentage of weight change, fasting blood glucose, insulin, resistin, white blood cell count, and neutrophil:lymphocyte ratio in donor mice after 8 days of diet.
(Q–V) the same parameters as (F)–(K) in recipient mice 19 days after inoculation.
*p < 0.05, **p < 0.01, ***p < 0.001 Dunnett’s post-hoc test versus 18% control group following significant one-way ANOVA F test. Error bars are standard deviations.
