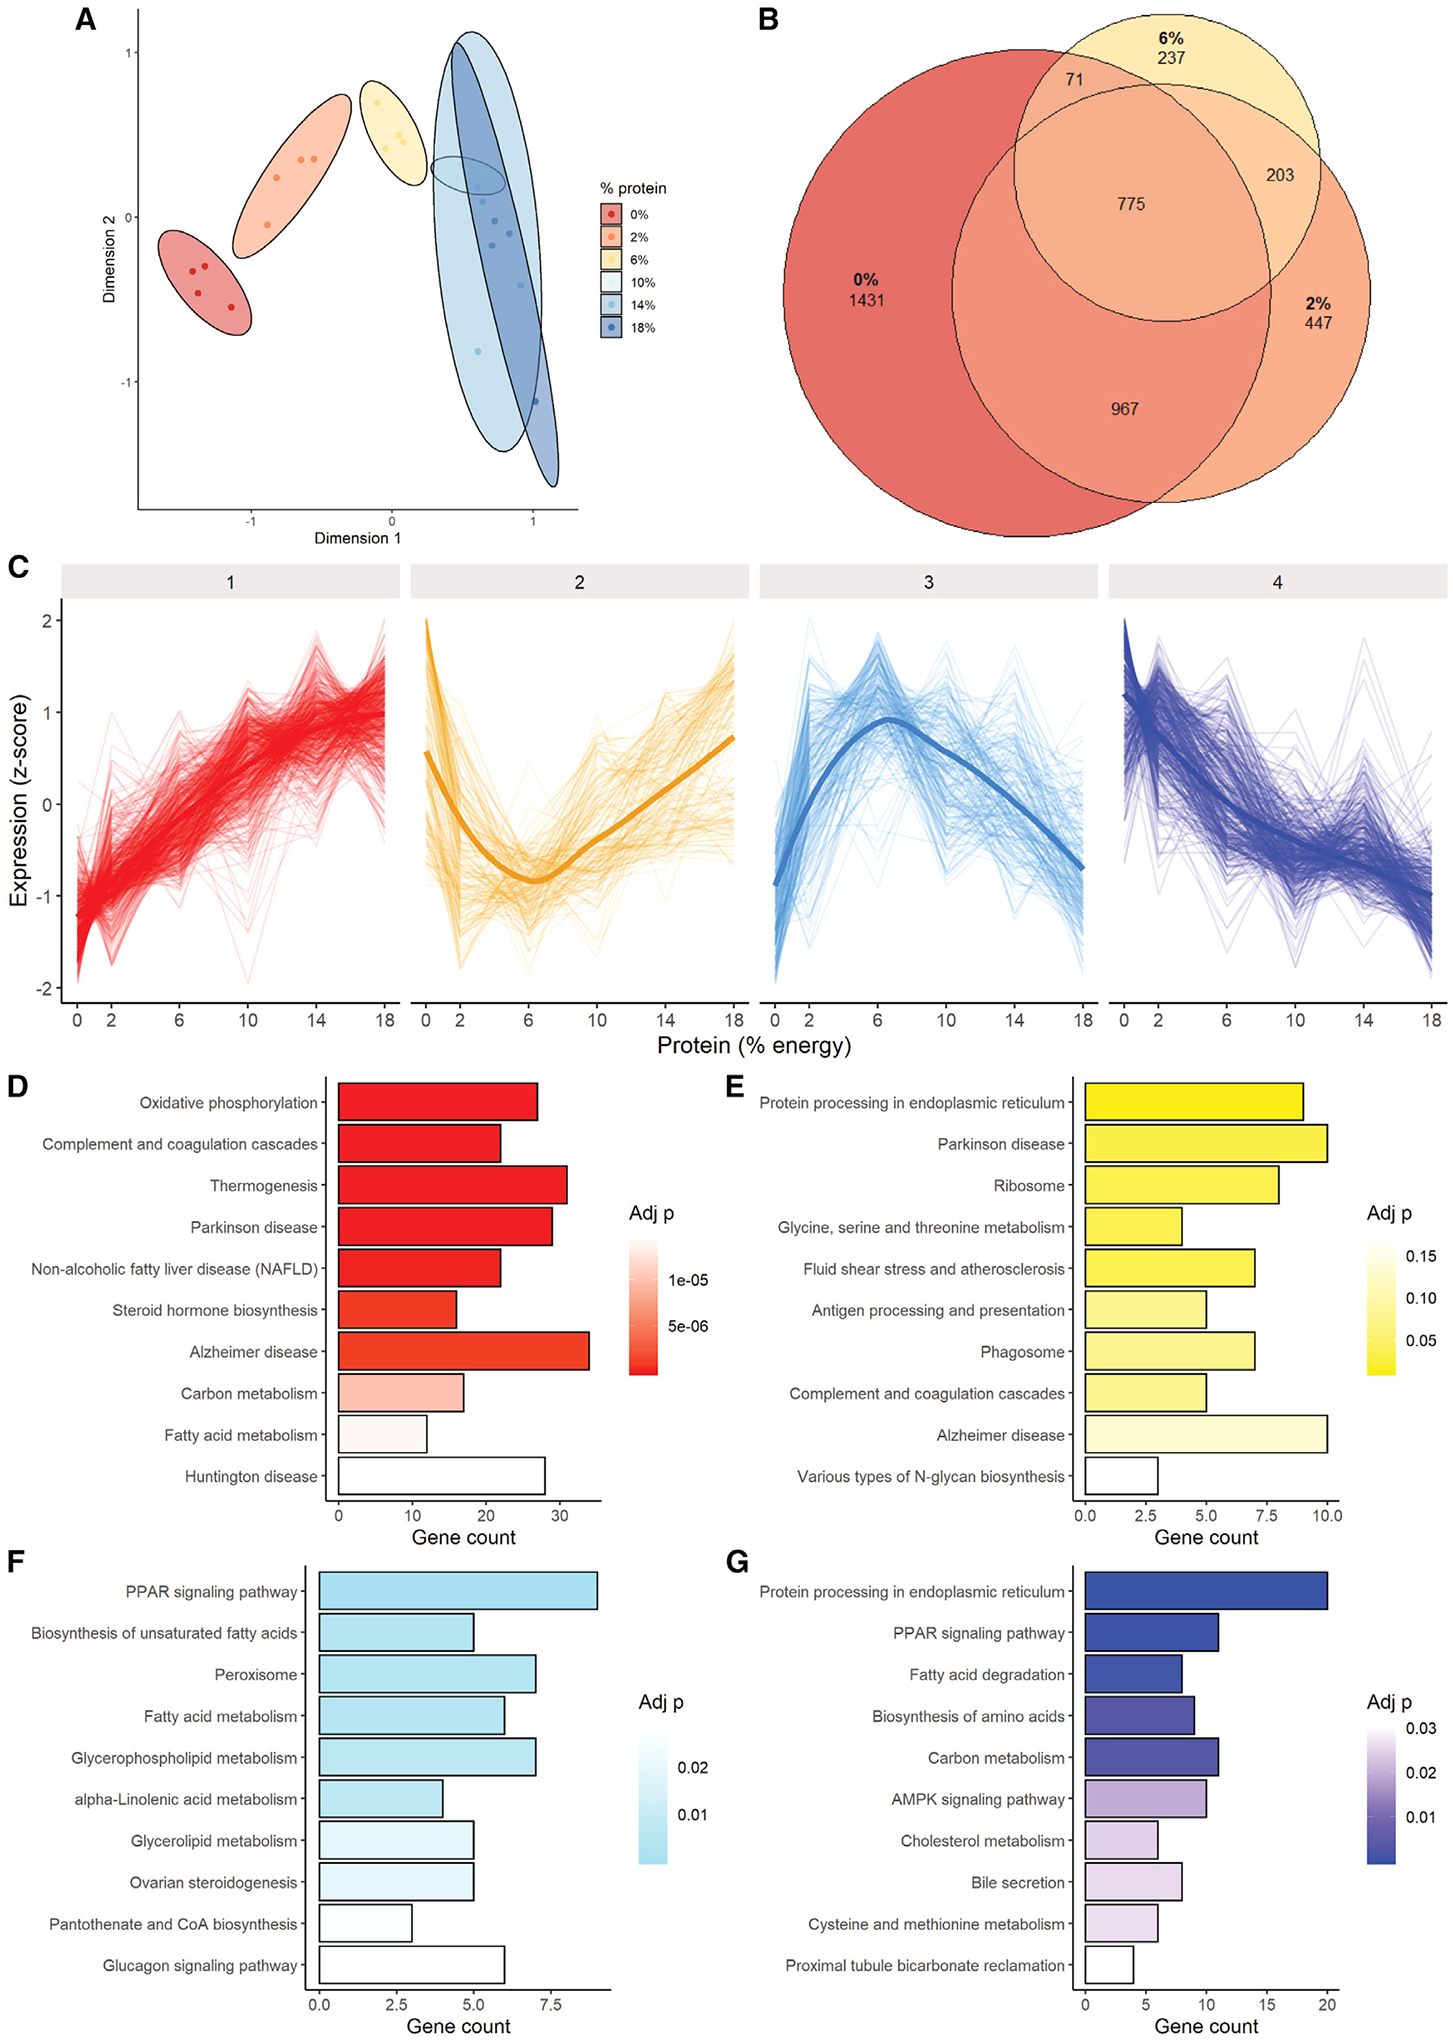
Figure 3. Effects of dietary protein titration on hepatic transcriptome.

Adult male B6D2F1 mice (4/group) were fed ad libitum for 1 week on an isocaloric semi-purified diet of the indicated protein calorie percentage, and liver transcriptomes were analyzed.
(A) Multidimensional scaling distances.
(B) Venn diagram of significantly differentially expressed genes in 0%, 2%, and 6% protein groups versus 18% control.
(C) Clustering analysis separated into four major cluster patterns.
(D–G) Pathway enrichment in the 4 major clusters identified in (C).
See also Figure S3.
