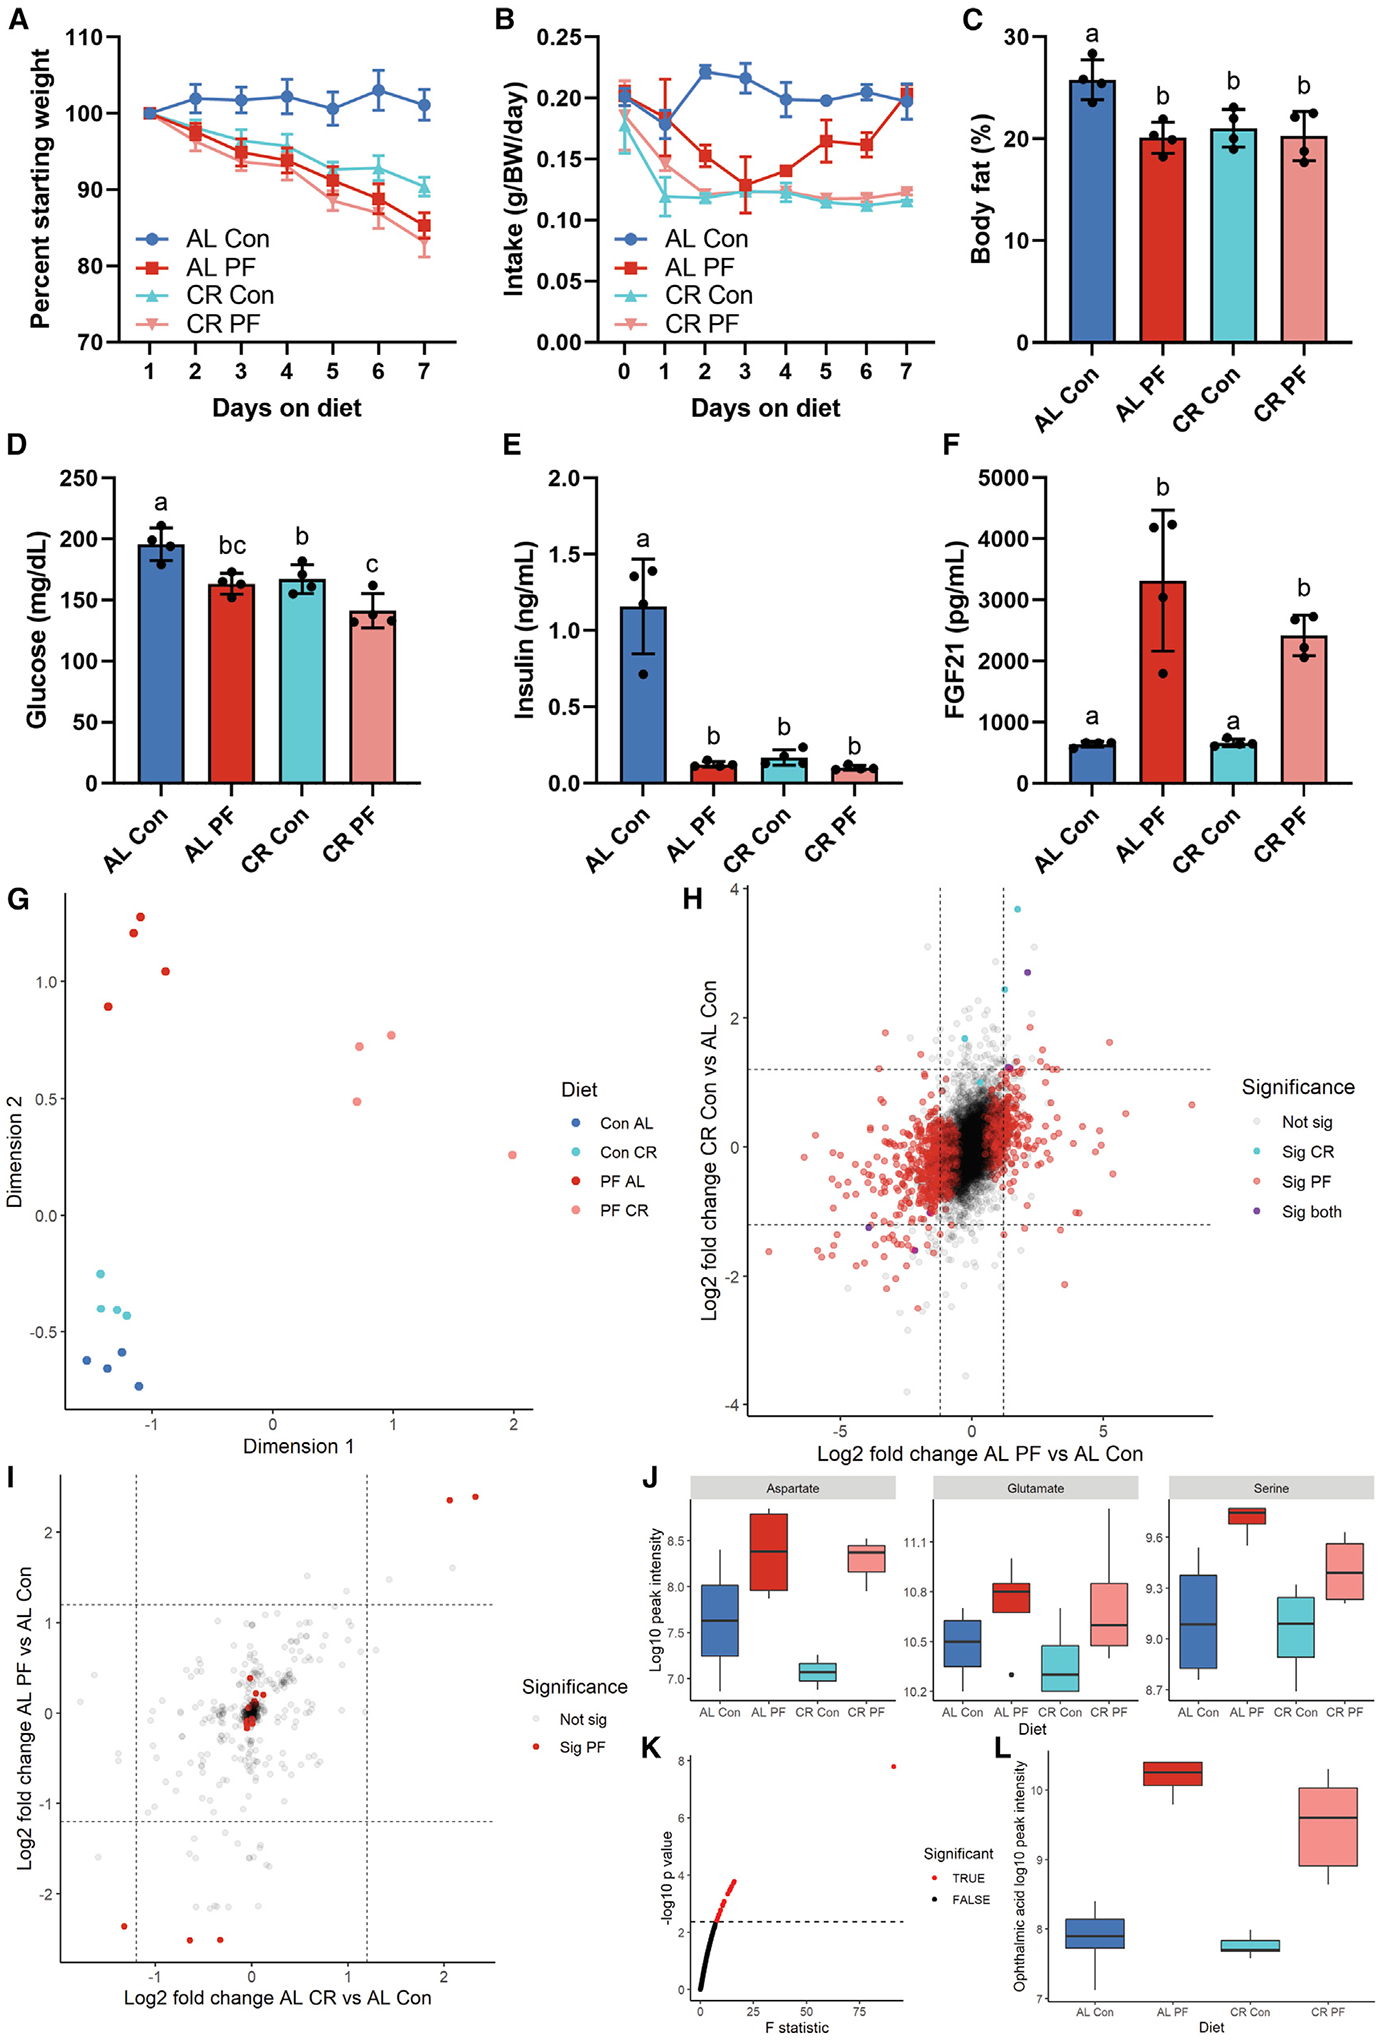
Figure 5. Phenotypic effects of dietary protein and calorie restriction.

Adult male B6D2F1 mice (n = 4/group) were fed ad libitum (AL) or 40% calorie restricted (CR) on a control 18% protein (Con) or 0% protein (PF) diet for one week.
(A) Daily body weight expressed as percentage of starting weight.
(B) Daily food intake normalized to body weight.
(C–F) Body fat percentage (C), blood glucose (D), serum insulin (E), and FGF21 (F) in the fasted state after 1 week on diet.
(G) MDS plot of hepatic transcriptome data.
(H) Scatterplot of log2 fold changes of hepatic transcripts versus AL Con of AL PF (x axis) and CR Con (y axis).
(I) Scatterplot of log2 fold changes in hepatic metabolites versus AL Con of AL PF (x axis) and CR Con (y axis).
(J) Boxplots of non-essential amino acids aspartate, glutamate, and serine across diets.
(K) One way ANOVA F-statistic values for hepatic metabolites; red indicates FDR-adjusted p <0.1.
(L) Boxplots of ophthalmic acid, the metabolite with the largest ANOVA F statistic, across diets. Error bars are standard deviations; different letters indicate p < 0.05 in Tukey post-hoc test following significant one-way ANOVA F test.
See also Figure S5.
