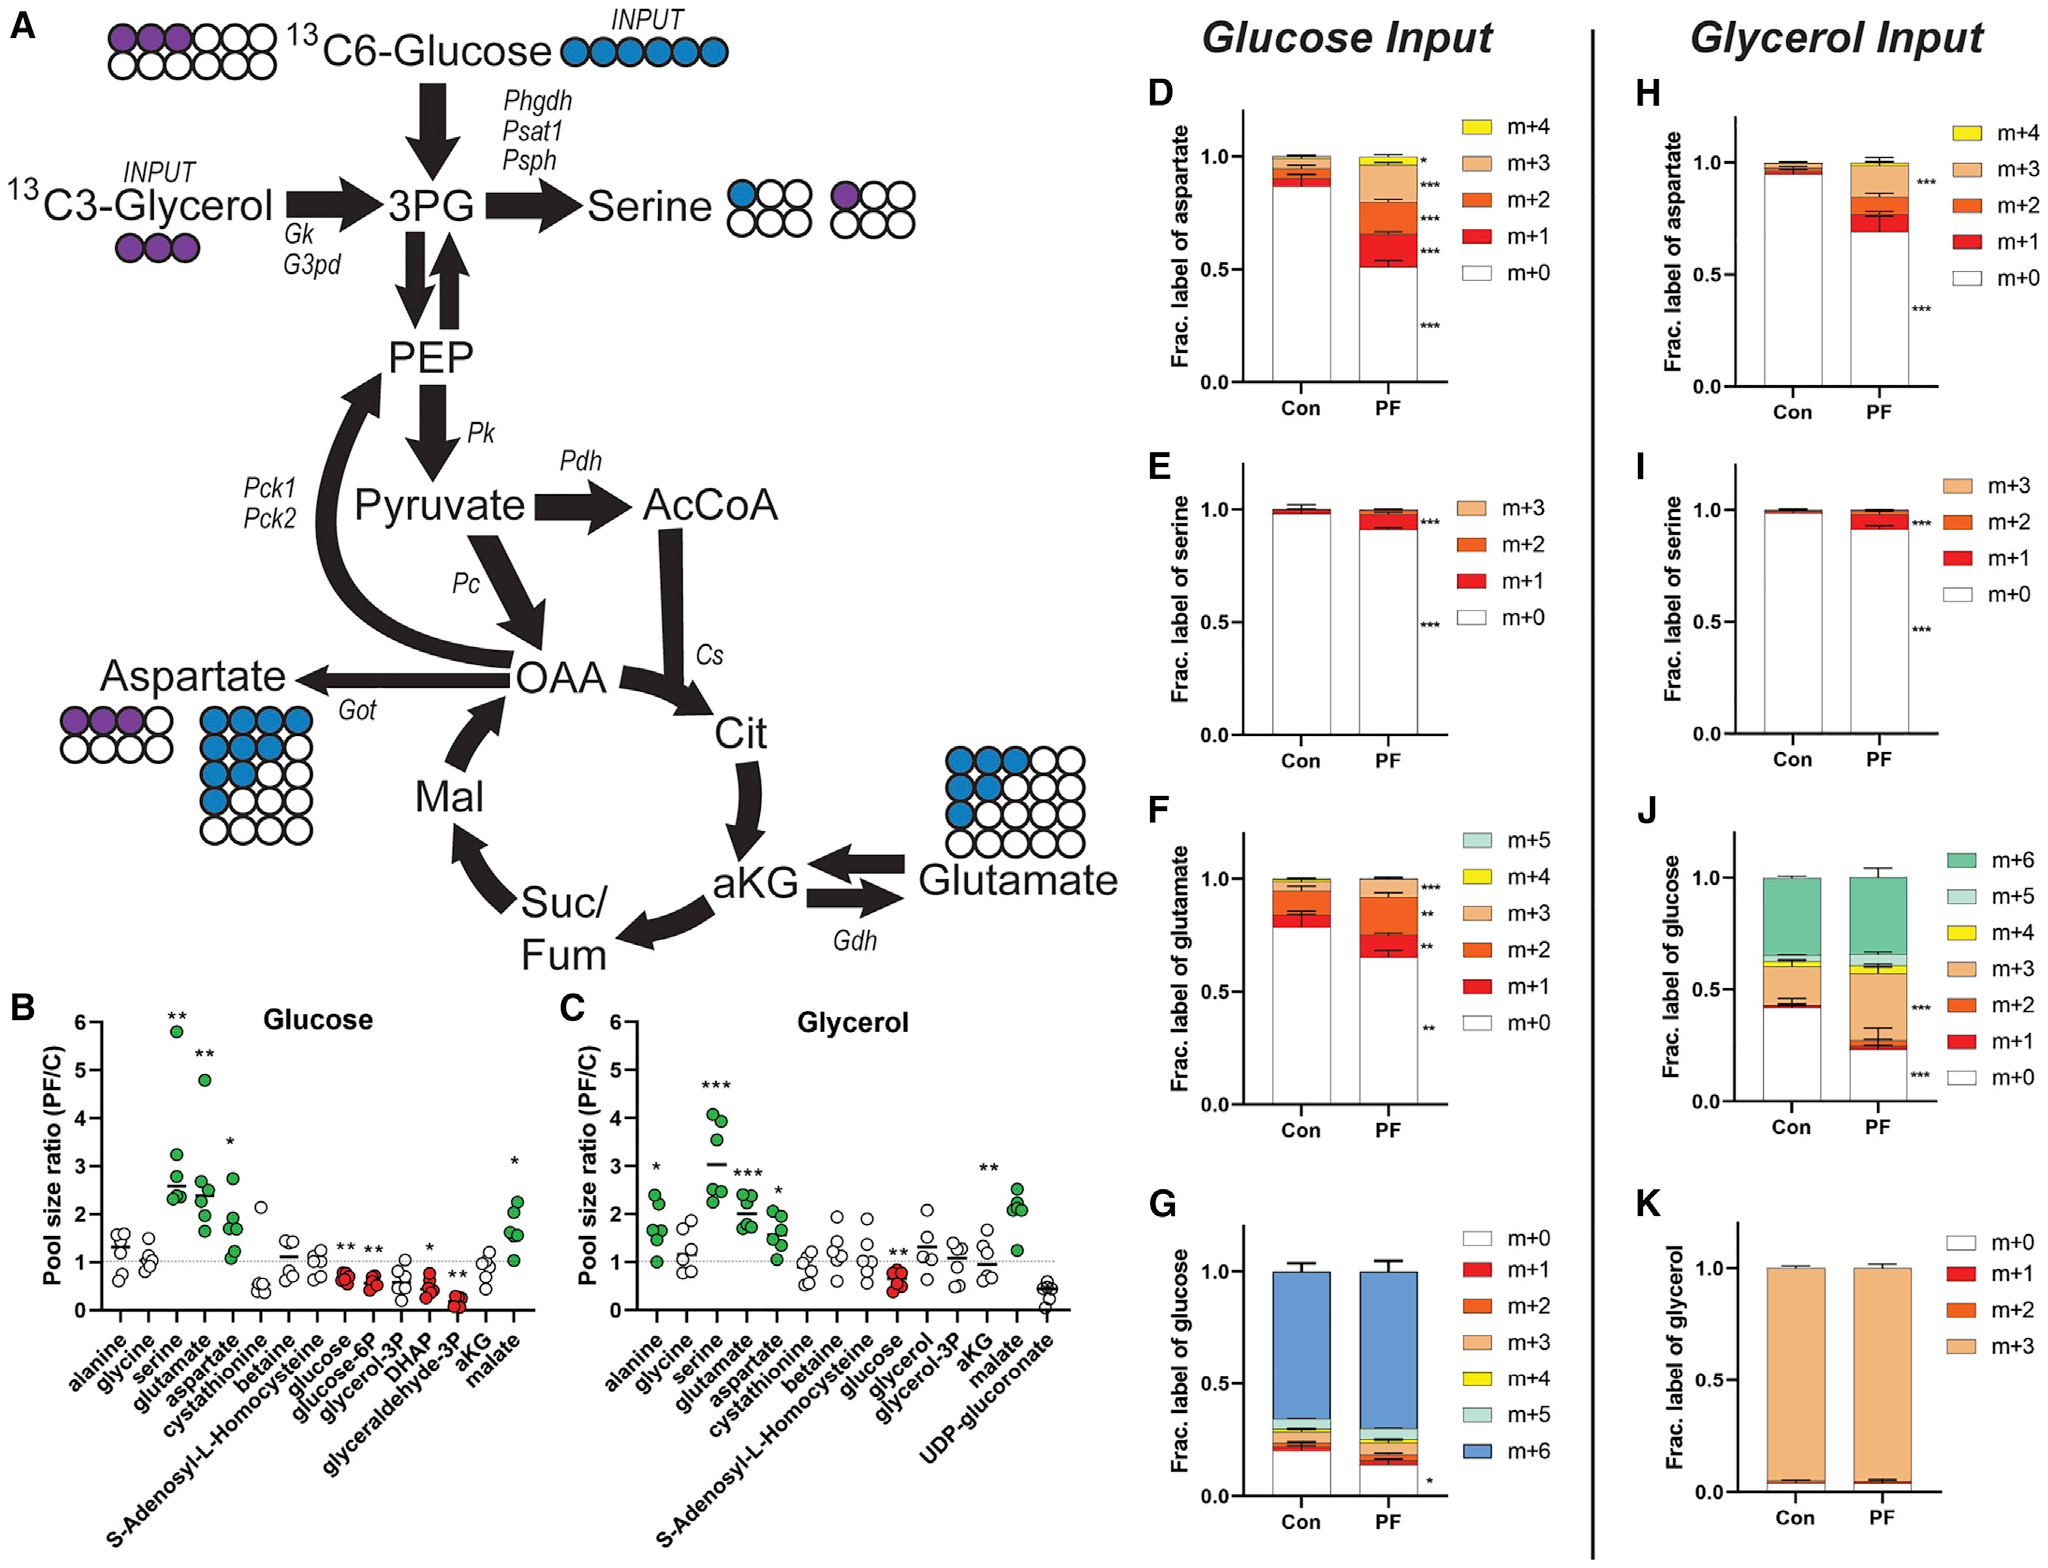
Figure 6. Effects of dietary protein restriction on hepatic glucose and glycerol flux.

(A) Diagram showing unlabeled (open circle) and labeled carbon from glucose (blue) or glycerol (purple) in fractionally enriched glycolytic/gluconeogenic and citric acid cycle metabolites relevant to amino acid metabolism.
(B and C) Total pool sizes (labeled plus unlabeled) of the indicated metabolite from the glucose (B) or glycerol (C) labeling experiment.
(D–K) Mice subject edto 1 week on 18% protein (Con) or 0% protein (PF) diet and injected with a bolus of 13C6 glucose (D–G) or 13C3 glycerol (H–K) and polar metabolites extracted from the liver after 30 min. Fractional enrichment of heavy carbon derived from 13C6 glucose or 13C3 glycerol incorporated into aspartate (D and H), serine (E and I), glutamate (F), or glucose (J) are indicated. (G and K) Tracer enrichment of 13C6 glucose (G) or 13C3 glycerol (K) in liver.
*p < 0.05, **p < 0.01, ***p < 0.001 between diet groups using FDR-corrected Student’s t test. Error bars are standard deviations, n = 6 per group.
