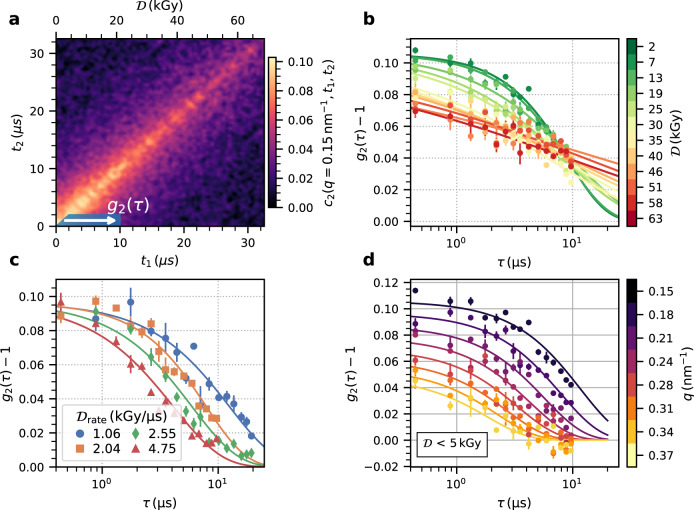
Fig. 3. Correlation functions.
a Two-time correlation function, c2, of Ig-PEG measured with an average dose rate of 2.04 kGy μs−1 for q = 0.15 nm−1. b Correlation functions for different initial doses ( kGy μs−1, q = 0.15 nm−1). c Correlation functions with an initial dose below 5 kGy for different dose rates at q = 0.15 nm−1. d Correlation functions for different momentum transfers fitted with a q-squared dependent relaxation rate ( kGy μs−1). The error bars represent the standard error over pixels and repetitions. Source data are provided as a Source Data file.

