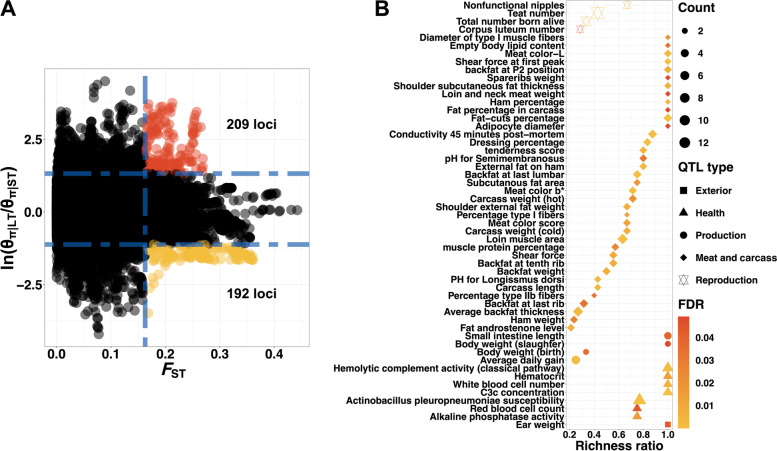
Fig. 2.
Teat number relevant traits-specific selection signature detection. A Detection of traits-specific selection signatures based on the constructed population pairs with extreme differences in total teat number. The Y-axis displayed the θπ ratio and the X-axis showed the FST value. The 1% of windows with the highest θπ ratio and FST values was considered the potential selection regions. B QTL enrichment analyses with teat number relevant traits-specific selection signature detection. The richness factor was obtained by the ratio of the number of QTLs annotated in the candidate regions and the total number of each QTL

