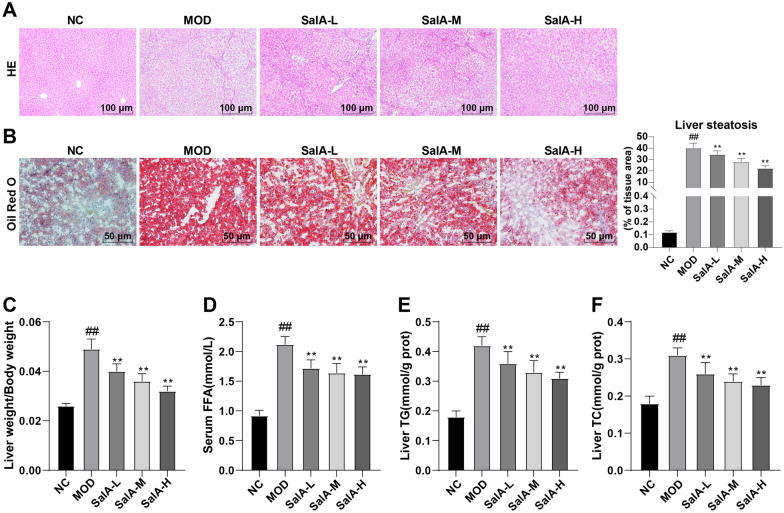
Fig. 2.
Effects of SalA on hepatic lipid metabolism and liver injury in ZDF rats. A HE staining of liver tissue; B Oil red O staining of liver tissue; C liver weight/BW; D serum FFA level; E, F liver TC and TG levels. N = 10. Data were expressed as mean ± standard deviation. One-way ANOVA test was used for data comparison between two groups, and Tukey’s test was used for the post hoc test. Data comparison between the MOD group and the NC group, ##P < 0.01; data comparison between the SalA-L, SalA-M, and SalA-H groups and the MOD group, **P < 0.01

