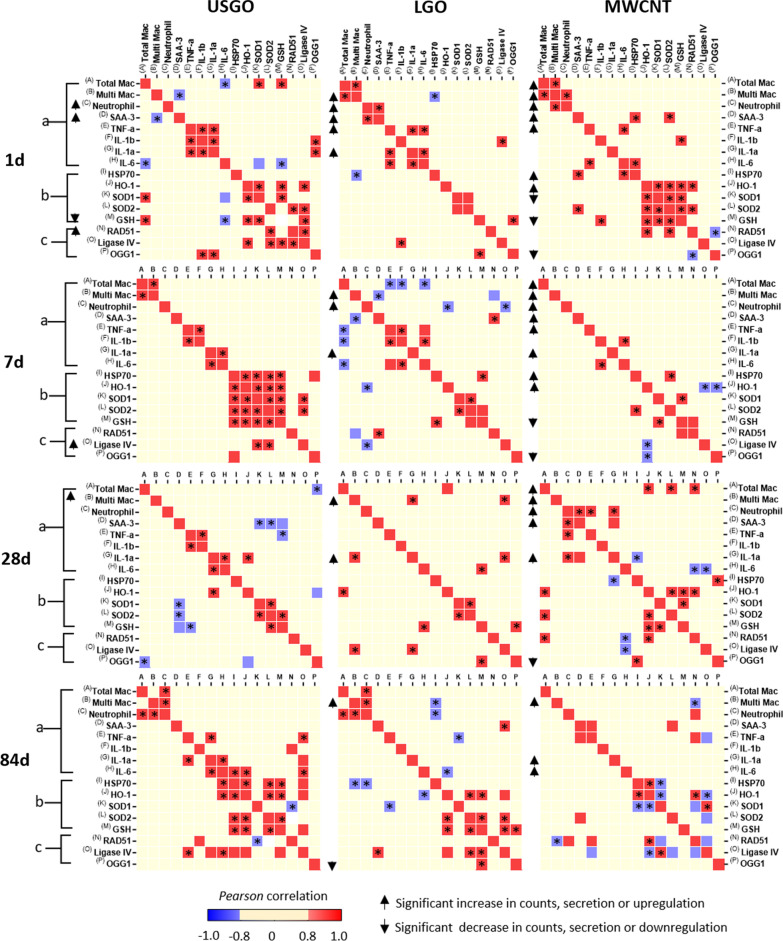
Fig. 5.
Correlation matrix of inflammation, oxidative stress and DNA repair in lungs of mice repeatedly exposed by oro-pharyngeal aspiration to a high dose of GOs or MWCNTs. Data of multiple biomarkers were gathered and then transformed in log2 of fold change compared to negative control (water for injection) before the Pearson correlation analysis was performed. Group (a) represents the inflammation markers: with cellular markers determined from BALF analysis [26] (A = Total Mac (number of macrophages); B = Multi Mac (number of multinucleated macrophages); C = Neutrophils (number of Neutrophils)) and with pro-inflammatory cytokines detected by ELISA in lung tissue (D = Saa3; E = TNF-α; F = IL-1β; G = IL-1α; H = IL-6). Group (b) represents oxidative stress markers (I = HSP70, J = HO-1, K = SOD1, L = SOD2 and M = GSH) assessed by RT-qPCR [26]. Group (c) represents DNA repair proteins (N = RAD51, O = LIG4 and P = OGG1) assessed by RT-qPCR in whole lung tissue. Increased cell counts, secretion and upregulated expression are highlighted by upward arrows adjacent to the matrix, and decreased or downregulated are highlighted by downward arrows. Pearson positive correlation is highlighted by red squared boxes and negative correlation by blue squared boxes. Significance level of the correlation *p < 0.05. The Pearson values and their respective p values of significance are reported in tables in the supplementary content

