
Fig. 2.
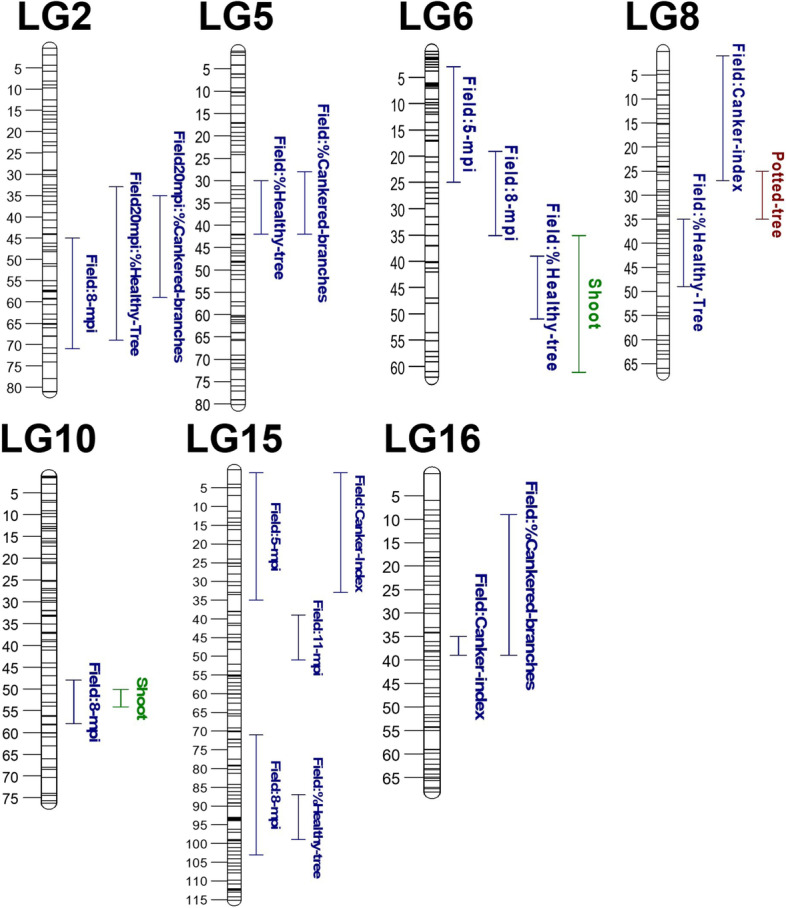
QTL regions identified to be associated with resistance to European apple canker. The figure shows QTL intervals from each measured phenotype. Different colours indicate distinct phenotyping experiments
Official websites use .gov
A
.gov website belongs to an official
government organization in the United States.
Secure .gov websites use HTTPS
A lock (
) or https:// means you've safely
connected to the .gov website. Share sensitive
information only on official, secure websites.
QTL regions identified to be associated with resistance to European apple canker. The figure shows QTL intervals from each measured phenotype. Different colours indicate distinct phenotyping experiments