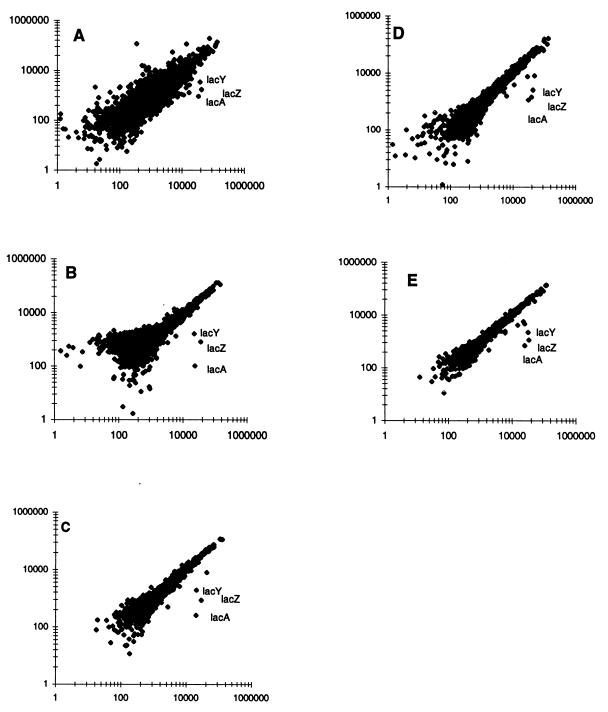
FIG. 1.
Analysis of IPTG induction. Basal expression levels expressed as normalized equivalent readings were plotted on the ordinate, and induced levels, also normalized equivalent readings, were plotted on the abscissa. (A) Results obtained when two Cy-3-labeled probes were hybridized to duplicate whole genome array sets. (B) Experiment in which the Cy-5-labeled cDNA copy of control DNA and the Cy-3-labeled copy of induced RNA were coannealed to a single slide set. The RNAs used to generate the results in panel B were each labeled with the other dye to allow a “reciprocal” hybridization. The resulting data were averaged with the data presented in panel B to yield the scatter plot depicted in panel C. A second independent set of RNA samples were isolated, their cDNAs were labeled with both dyes, and the products were hybridized in both possible combinations to generate the results depicted in panel D. (E) Averaged results of the two independent experiments depicted in panels C and D.

